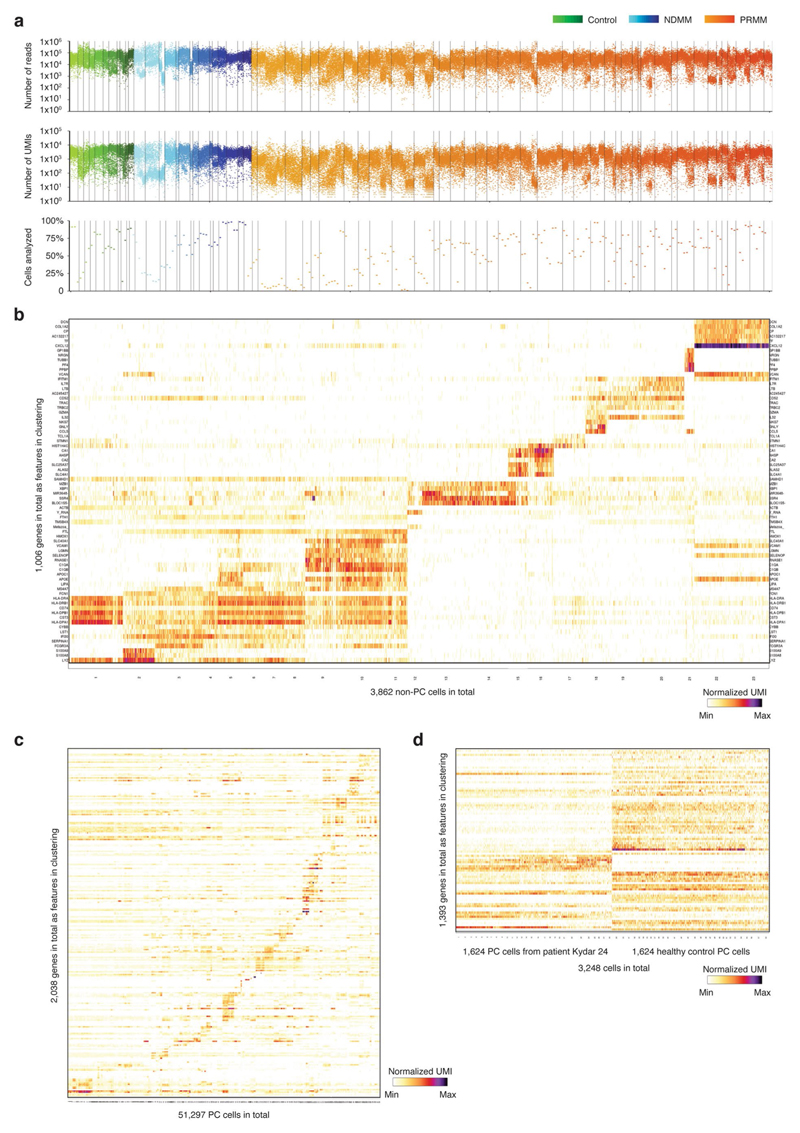
Extended Data Fig. 2. Overview of quality control and data analysis for the single bone marrow plasma cells.
a, Dot plots showing number of reads, number of UMIs, and percentage of cells analyzed per batch of 384 cells (that were pooled for library construction) for all CD38+CD138+ bone marrow single cells from 66 participants (11 control donors, 15 NDMM patients, and 40 PRMM patients). (Methods). b, Heat map showing clustering analysis of 3,862 ‘contamination’ cells that pass quality control but do not express key plasma genes. Shown are representative genes of non-PC. c, Heat map showing clustering analysis of 51,297 PC sorted from all the 66 participants featuring normalized single cell expression levels of a selected set of most variable genes. Clustering is performed using 2,038 genes as features. d, Heat maps showing clustering analysis of PC from patient KYDAR 21 (left) together with the same number of PC from healthy control group (right) using 1,393 gene features.

