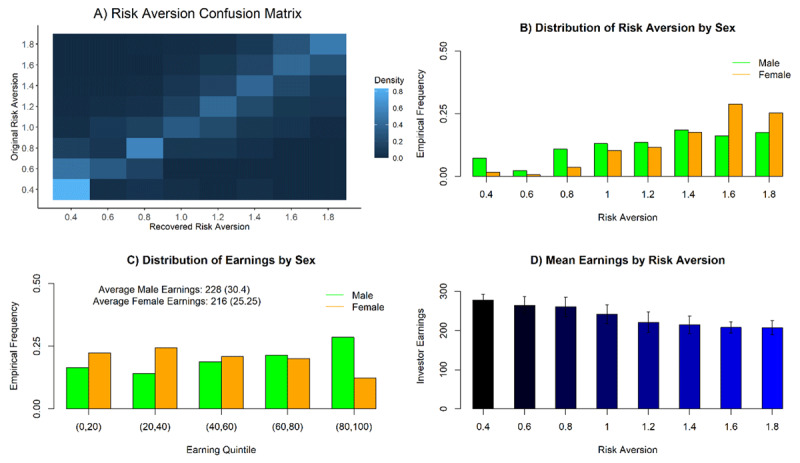
Figure 2.

From top left to bottom right. A) Confusion matrix: trajectories were sampled from the generative model using the full collection of parameters inferred from each subject (y-axis); then new parameter values were re-estimated from these trajectories (x-axis). The matrix shows the conditional probability of the re-estimated value of risk aversion as a function of the generating risk aversion. Lighter values indicate higher probabilities. Rows sum to 1. B) Frequency of occurrence of each risk aversion value, separated by sex. C) Average earnings separated by sex and classified according to membership in total earnings quintiles in this study. D) Average investment levels separated by subjects’ Risk Aversion parameter. Error bars are standard deviations (SD).
