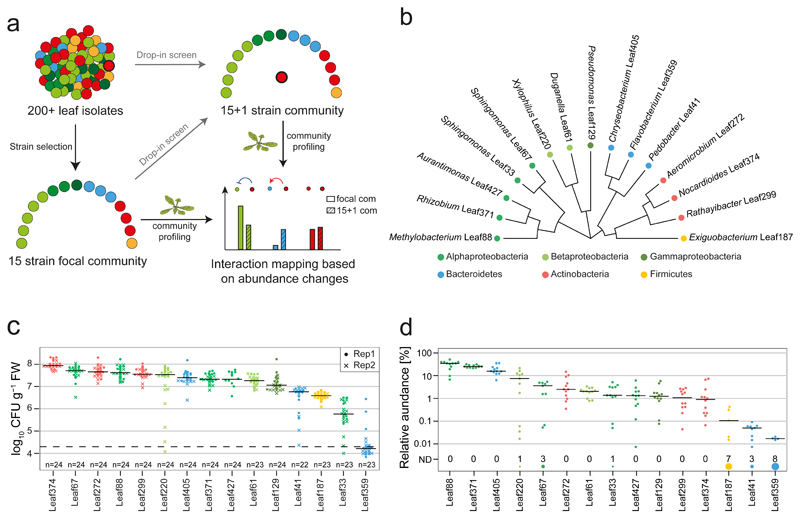
Fig. 1. A 15-strain focal SynCom to map bacteria-bacteria interactions.
a) Graphical representation of experimental design for interaction screening. b) Phylogenetic tree representing the selected strains based on full-length 16S rRNA gene sequences. c) Phyllosphere colonization by each focal strain in mono-association with A. thaliana Col-0 plants. Seedlings were inoculated with bacterial suspensions 7 days after planting and bacteria were enumerated 21 days later by CFU counting on R-2A+M agar. The limit of detection is indicated by a dashed line. The data across two independent experiments are shown. d) Relative focal community composition in the phyllosphere after 21 days based on 16S rRNA gene amplicon sequencing (n= 12). The number of replicates in which a particular strain was not detected (ND) are shown by the size of the circle and the count above the strain name. Colors throughout the figure correspond to the phylum, and in case of Proteobacteria, the respective class.

