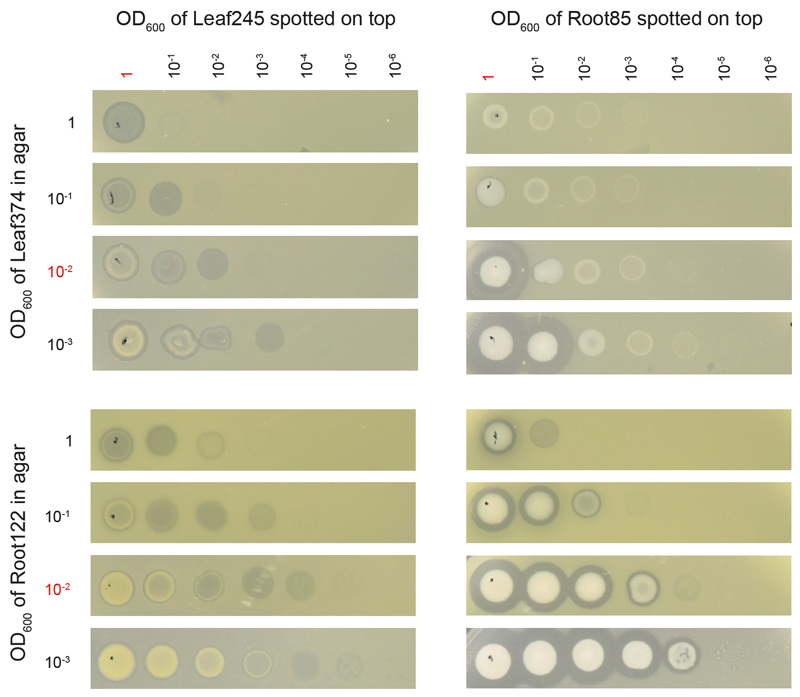
Extended Data Figure 7. In vitro inhibition assay with different producer and target cell densities.
The concentrations of the NlaP producer strains (Leaf245 and Root85) spotted on top (2 µL) and target strains (Leaf374 and Root122) within the agar are indicated on top and on the left of the graph, respectively. Pictures were taken 36 hours after overlay preparation and spotting. The standard concentrations used for all other assays performed in this study are highlighted in red.

