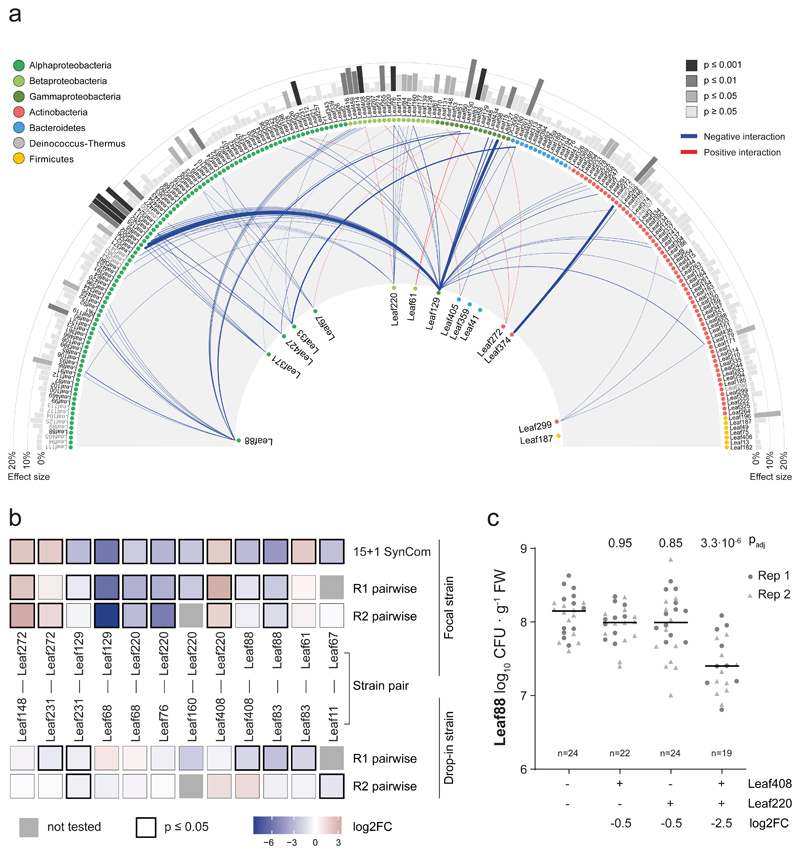
Fig. 2. Interactions of the At-LSPHERE collection with the focal SynCom in planta.
a) Interaction map showing all interactions identified between At-LSPHERE strains (top) and the focal community (bottom) based on log2-transformed abundance changes (DESeq2-normalized counts, Wald test, Benjamini-Hochberg corrected, padj ≤ 0.01, nfocal community = 16, ndrop-in = 3). Positive (red) and negative (blue) interactions are shown as connecting lines between drop-in strain (outside) and focal strain (center). Line thickness corresponds to fold-change. Bars in the outermost ring correspond to the overall effect size of the perturbation on the focal community (principle component analysis, PERMANOVA). Strains are ordered by phylogeny based on full-length 16S rRNA gene sequences and dots are colored by bacterial phyla or Proteobacteria class. Drop-in strains that belong to the same ASV as a focal strain are labelled in grey as for these no interactions with the focal strain of the same ASV can be determined. b) Pairwise strain inoculations of selected interacting strains identified in a). On top, the focal strain log2 fold-change observed in a) is shown as a reference for each strain pair. Below, the log2 fold-changes (pairwise inoculation vs mono-association) for the focal strain and drop-in strain are shown based on absolute abundances obtained by CFU enumeration for two biological replicates. The color of the boxes reflects the observed log2 fold-change and the black frames around the boxes indicate a significant difference compared to the mono-association condition (two-sided Wilcoxon rank sum test, p ≤ 0.05). Combinations that were not tested in a given experiment are marked with a grey box. Seedlings were inoculated at day 14 (replicate 1, R1) or day seven (replicate 2, R2) after planting. Exact p-values and number of replicates are provided in the source data. c) Phyllosphere colonization by Methylobacterium Leaf88 in mono-association or in combination with Xylophilus Leaf220, Methylophilus Leaf408 or both. Shown are the median and individual data points of log10-transformed CFU per g plant fresh weight across two independent experiments. Exact p-values (Kruskal-Wallis and post-hoc Dunn test, Bonferroni adjusted p) are indicated above and log2 fold changes below the graph. For the corresponding colonization levels of Leaf220 and Leaf408, see Extended Data Fig. 3.

