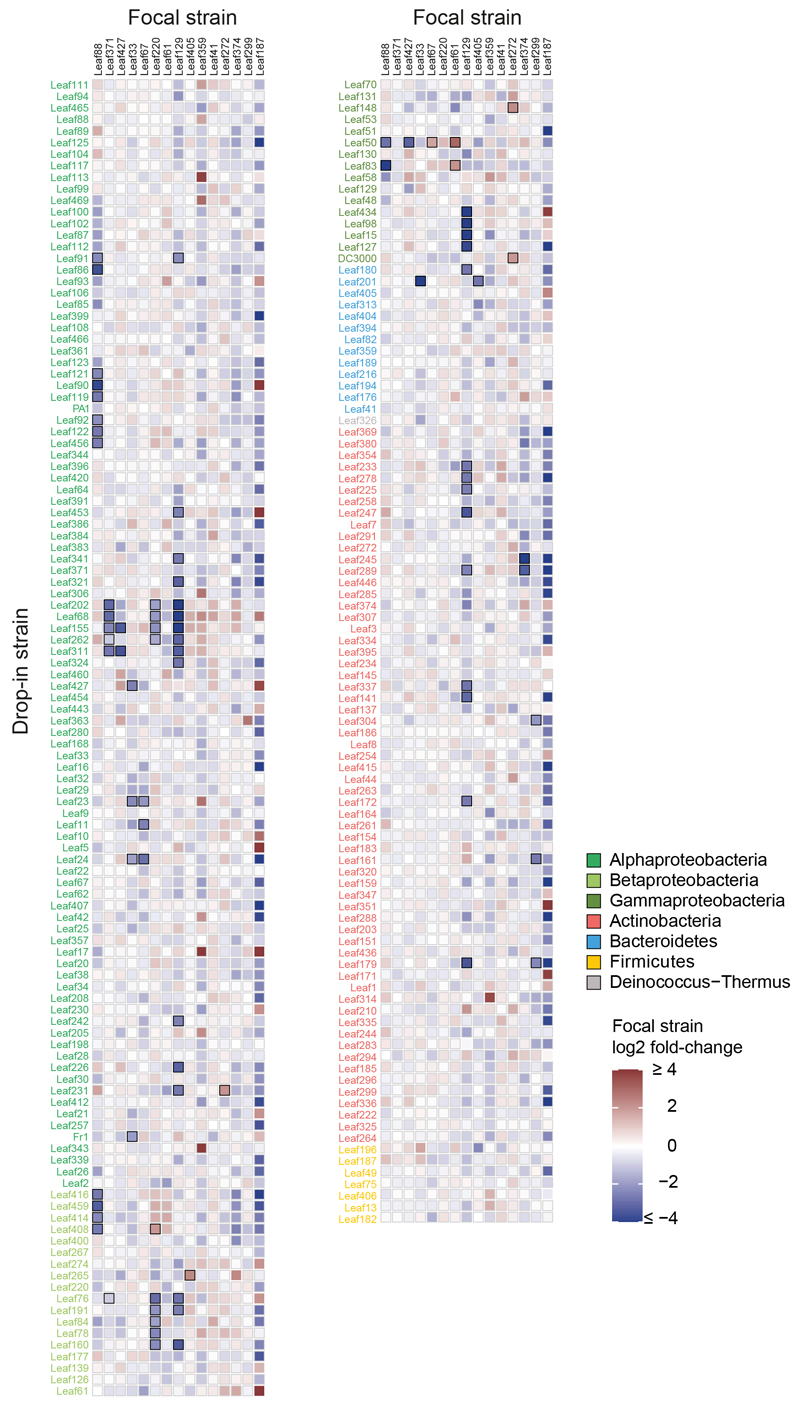
Extended Data Figure 1. Changes in focal community strain abundances upon strain drop-in.
Heatmap showing log2-transformed fold changes (treatment vs control) for each focal community strain (top) upon strain drop-in (left). Significant changes (DESeq2-normalized counts, Wald test, Benjamini-Hochberg corrected, padj ≤ 0.01, nfocal community = 16, ndrop-in = 3) are indicated with a black frame. Drop-in strains are colored by phylum or Proteobacteria class. Exact p-values are provided in Supplementary Table 2.

