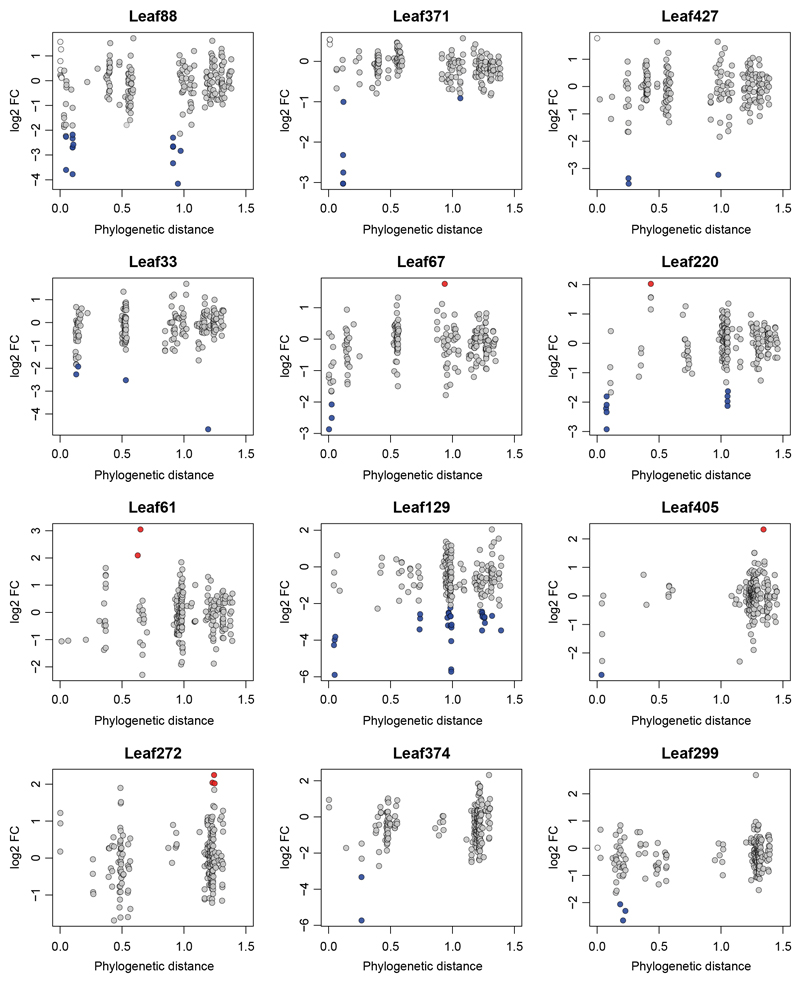
Extended Data Figure 2. Phylogenetic distance of interacting strains.
Focal strains that showed ≥ 1 interaction are shown. The phylogenetic distance of the focal strain to all added strains is indicated on the x-axis. Log2-fold changes (log2FC) are shown on the y-axis. Significant fold-changes are highlighted with blue (negative interactions) or red (positive interactions) fill color. Strains that belong to the same ASV as a focal strain have a light grey fill color.

