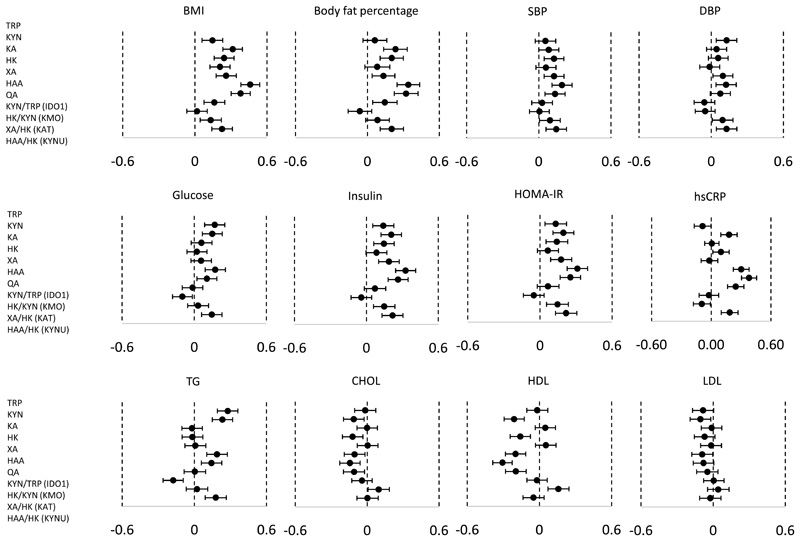
Figure 3. Association of KYN metabolites with metabolic risk factors.
X-axes show standardized scores of BMI, body fat percentage, systolic blood pressure (SBP), diastolic blood pressure (DBP), glucose, insulin, Homeostatic Model Assessment for Insulin Resistance (HOMA-IR), high sensitivity C-reactive protein (hsCRP), triglycerides (TG), total cholesterol (CHOL), high density lipoprotein-cholesterol (HDL) and low density lipoprotein-cholesterol (LDL). Forest plots show the differences (95% CI) in standardized score of metabolic risk factor of children at 8 years with change in each standardized score of cord KYN metabolite or ratio (Y-axis). Models were adjusted for sex and ethnicity. Total sample size (N) is not always 552 due to the missing values for outcomes.

