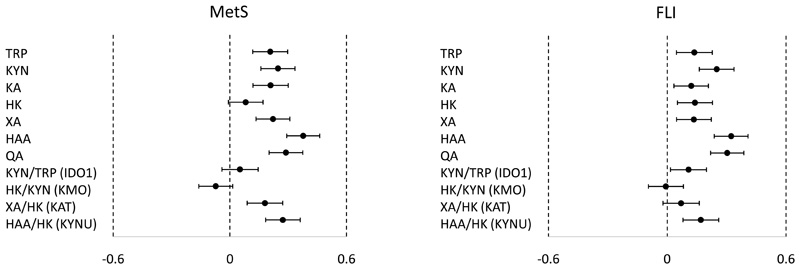
Figure 4. Association of KYN metabolites with metabolic syndrome score and fatty liver index.
X-axes show standardized scores of metabolic syndrome score (MetS) and fatty liver index (FLI). Forest plots show the differences (95% CI) in MetS (left) or standardized score of FLI (right) of children at 8 years with change in each standardized score of cord KYN metabolite or ratio (Y-axis). Models were adjusted for sex and ethnicity. Total sample size (N) is not always 552 due to the missing values for outcomes.

