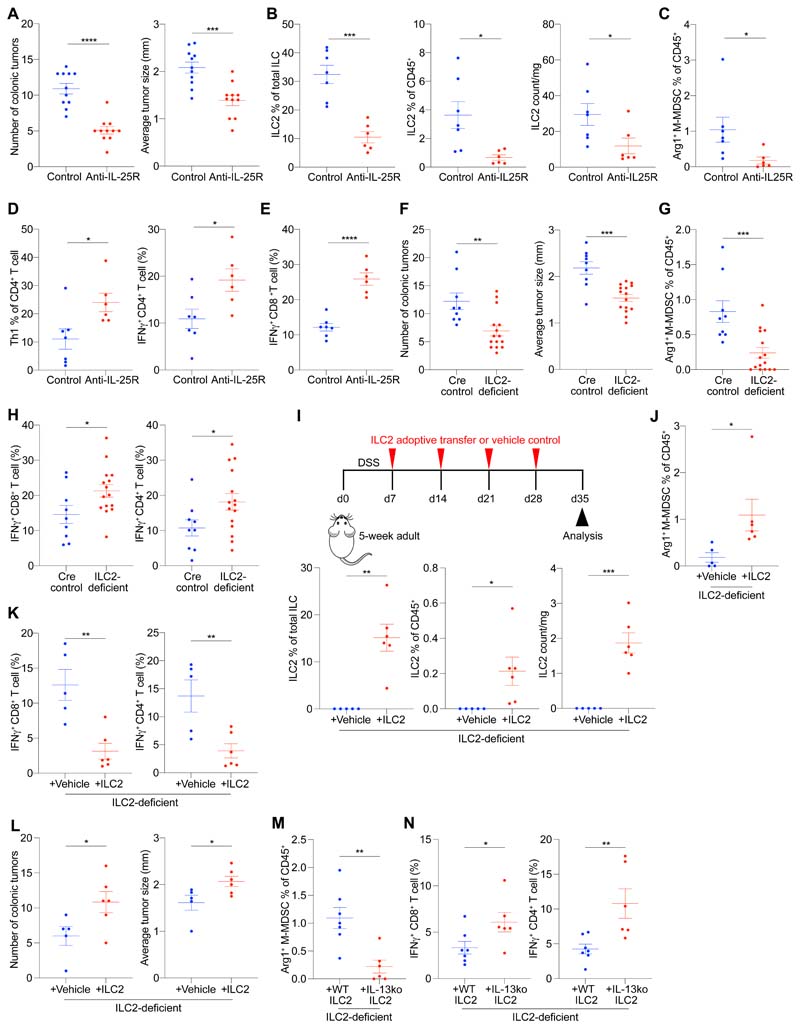
Fig. 7. Therapeutic anti-IL-25R treatment shows mechanistic conservation against mice colonic adenocarcinoma.
(A) Number of colonic tumors and average tumor size in anti-IL-25R or control IgG1-treated Apc1322T/+-DSS mice (control IgG1, n = 11; anti-IL-25R, n = 11). Apc1322T/+-DSS mice, dextran sulfate sodium treated Apc1322T/+ mice. (B and C) Frequency of ILC2s (B) and Arg1+ M-MDSCs (C) in anti-IL-25R or control IgG1-treated Apc1322T/+-DSS mice (control IgG1, n = 7; anti-IL-25R, n = 6). (D) Frequency of tumor Th1 cells and CD4+ T cell IFNγ expression in anti-IL-25R or control IgG1-treated Apc1322T/+-DSS mice (control IgG1, n = 7; anti-IL-25R, n = 6). (E) IFNγ expression in tumor CD8+ T cells from anti-IL-25R or control IgG1-treated Apc1322T/+-DSS mice (control IgG1, n = 7; anti-IL-25R, n = 6). (F) Number of colonic tumors and average tumor size (Cre control, n = 9; ILC2-deficient, n = 15) in ILC2-deficient (Roraf/fIl7rCre/+) and Cre control (Rora+/+Il7rCre/+) Apc1322T/+-DSS mice. (G) Frequency of colonic tumor Arg1+ M-MDSCs (Cre control, n = 9; ILC2-deficient, n = 15) from ILC2-deficient and Cre control Apc1322T/+-DSS mice. (H) IFNγ expression in colonic tumor CD8+ and CD4+ T cells (Cre control, n = 9; ILC2-deficient, n = 15) from ILC2-deficient and Cre control Apc1322T/+-DSS mice. (I) Schematic (top) of ILC2-deficient Apc1322T/+-DSS mice adoptively transferred with ILC2s or control, and frequency (bottom) of colonic tumor ILC2s at point of analysis (Control, n = 5; ILC2, n = 6). (J) Frequency of Arg1+ M-MDSCs in ILC2-deficient Apc1322T+-DSS mice adoptively transferred with ILC2s or control (Control, n = 5; ILC2, n = 6). (K and L) IFNγ expression in colonic tumor CD8+ and CD4+ T cells (K), and colon tumor number and size (L), in ILC2-deficient Apc1322T/+-DSS mice adoptively transferred with ILC2s or control (Control, n = 5; ILC2, n = 6). (M and N) Frequency of colonic tumor Arg1+ M-MDSCs (M), and CD8+ and CD4+ T cell IFNγ expression (N) in ILC2-deficient Apc1322T/+-DSS mice adoptively transferred with wild type or IL-13-deficient ILC2s (wild type, n = 7; IL-13-deficient, n = 6). Data collected from age-matched female mice treated with DSS, and pooled from two or more independent experiments; error bars show mean ± SEM. Statistical significance determined by unpaired two-tailed t-test. *P < 0.05, **P < 0.01, ***P < 0.001, ****P < 0.0001.

