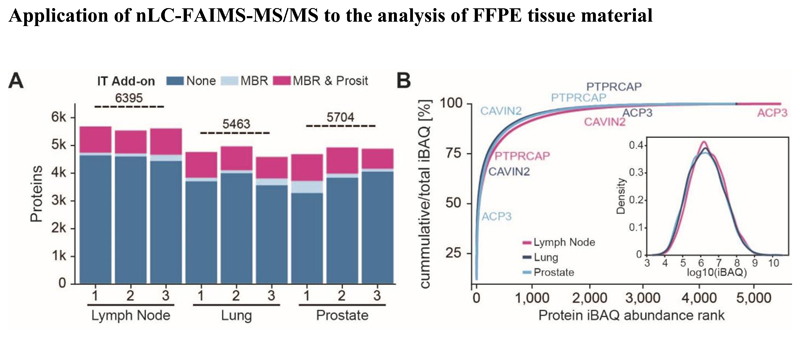
Figure 6.
Analysis of three exemplary human FFPE tissues (A) Number of proteins identified from lymph node, lung and prostate (n=3 each) by standard database searching, match-between-runs enabled and re-scored by Prosit. Horizontal lines depict the total number of proteins identified in each tissue. (B) Cumulative protein abundance distributions of the three human tissues. The inset shows a density plot of protein abundance measured by the iBAQ approach (intensity-based absolute protein quantification). Tissues are color coded and examples for proteins detected in all three tissues but in very different quantities are marked.

