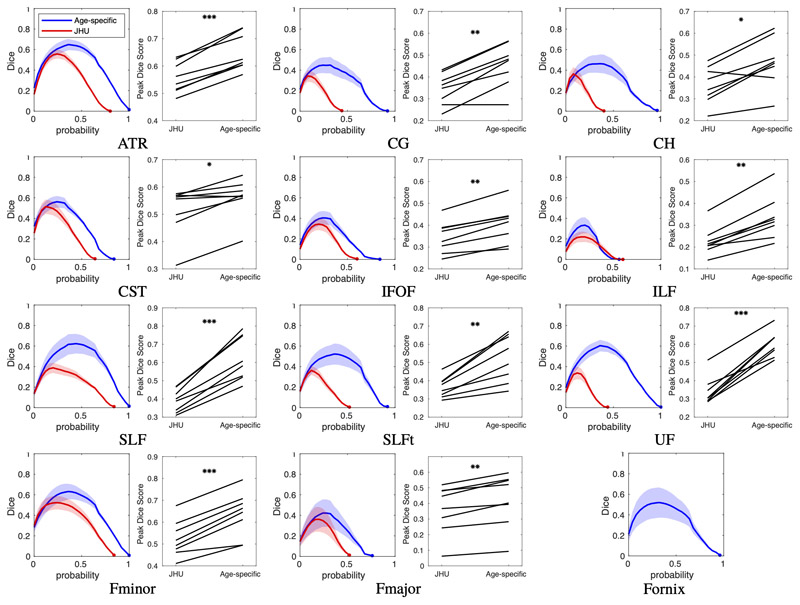
Figure 5.
Same-site validation of tract overlap with “gold-standard” subject specific tract tracing. For each tract, the plot on the left shows the Dice score of volumetric overlap (y axis) against probability threshold (x axis) when using the age-specific atlas (blue) or the JHU adult atlas (red), with lines showing the mean score for the 8 validation subjects not included in the formation of the atlas, and shaded regions show the 95% confidence interval of the mean. Also shown for each tract is a paired plot of the peak Dice scores calculated with each atlas. P-values, given in Table S1, are indicated by: *p < 0.05; **p < 0.001; ***p < 0.0001. Note that the age-specific atlas outperformed the JHU (adult) atlas in all tracts. The tract representing the fornix is not available in the JHU atlas so only the new mask was tested.

