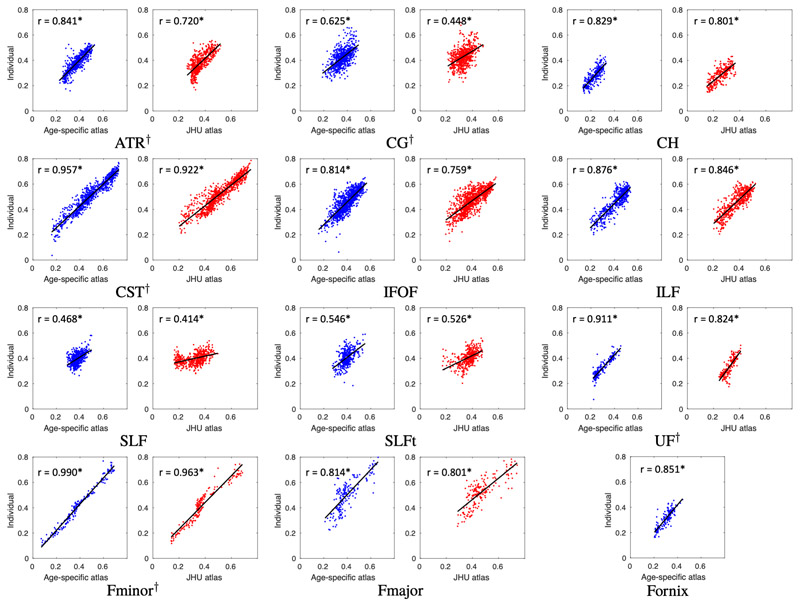
Figure 6.
Same-site validation of slice FA values. Plots show slice FA measured from individually traced tracts (i.e. the “gold-standard”) plotted against corresponding values extracted from the age-specific and JHU atlases. Each plot shows a point for every slice in each of the 8 validation subjects and the regression. Correlation coefficients are shown on each plot, measured using a repeated measures correlation (Bland and Altman, 1995). All tracts exhibit higher correlation when measured with the age-specific atlas than with the JHU adult atlas. This difference is significant in the ATR, CG, CST, UF and Fminor, as indicated by † next to the tract abbreviation. Confidence intervals and regression parameters are given in Table S2. *p < 10-20.

