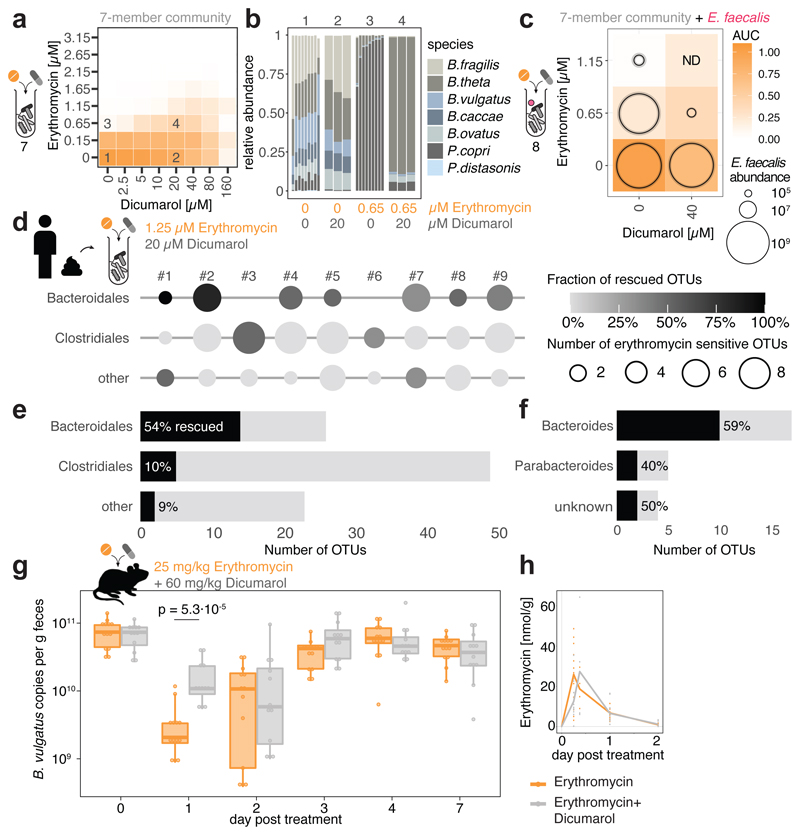
Figure 3. Dicumarol selectively protects Bacteroides species from erythromycin in microbial communities.
a. Checkerboard assay with a synthetic 7-member gut microbial community of Bacteroidales species (B. caccae, B. fragilis NT, B. ovatus, B. thetaiotaomicron, B. vulgatus, P. copri, P. distasonis) indicates that dicumarol rescues overall community growth. Heat map depicts median growth across triplicates.
b. Community compositions in selected erythromycin-dicumarol concentration combinations (1-4 referring to checkerboard tiles in a) demonstrate that dicumarol alone does not alter community structure, but rescues Bacteroides species from erythromycin (primarily B. thetaiotaomicron and B. ovatus, consistent with Extended Data Fig. 9a). Depicted are relative abundances of individual replicates as determined by 16S rRNA sequencing and rescaled to 100%.
c. When the Bacteroidales community contains the pathogen E. faecalis, the antidote dicumarol rescues community growth upon erythromycin treatment, but allows erythromycin to still target E. faecalis (even enhances its activity). Tiles show medians of normalized community growth and circles within tiles represent the mean±SD CFU/ml of E. faecalis (3 biological X 2 technical replicates; initial inoculum: 1.25·106 CFU/ml). ND: not detected (detection limit:104 CFU/ml).
d-f. In complex human-stool derived communities from 9 healthy donors, dicumarol protects most Bacteroidales Operational Taxonomic Units from erythromycin (per order – e; per genus – f), and at least one Bacteroidales OTU per individual. Circle diameter depicts the number of OTUs per order inhibited by erythromycin, and gradient fill the fraction of these OTUs rescued by dicumarol (2 biological X 2 technical replicates). All Bacteroidales of donors #3 and #6 are resistant to the erythromycin concentrations used.
g. Administration of dicumarol mitigates the decrease in fecal B. vulgatus counts that erythromycin causes in gnotobiotic mice colonized with a 12-member mouse microbiome31 and B. vulgatus. The mice were treated once orally with either erythromycin (N=13) or erythromycin/dicumarol (N=12) in three independent experiments. Boxes are plotted as in Fig. 1c. Only p-values for significant differences (two-sided Mann-Whitney U test) between two groups of mice at same day are shown.
h. Fecal erythromycin concentrations and kinetics do not differ between the two groups of mice.

