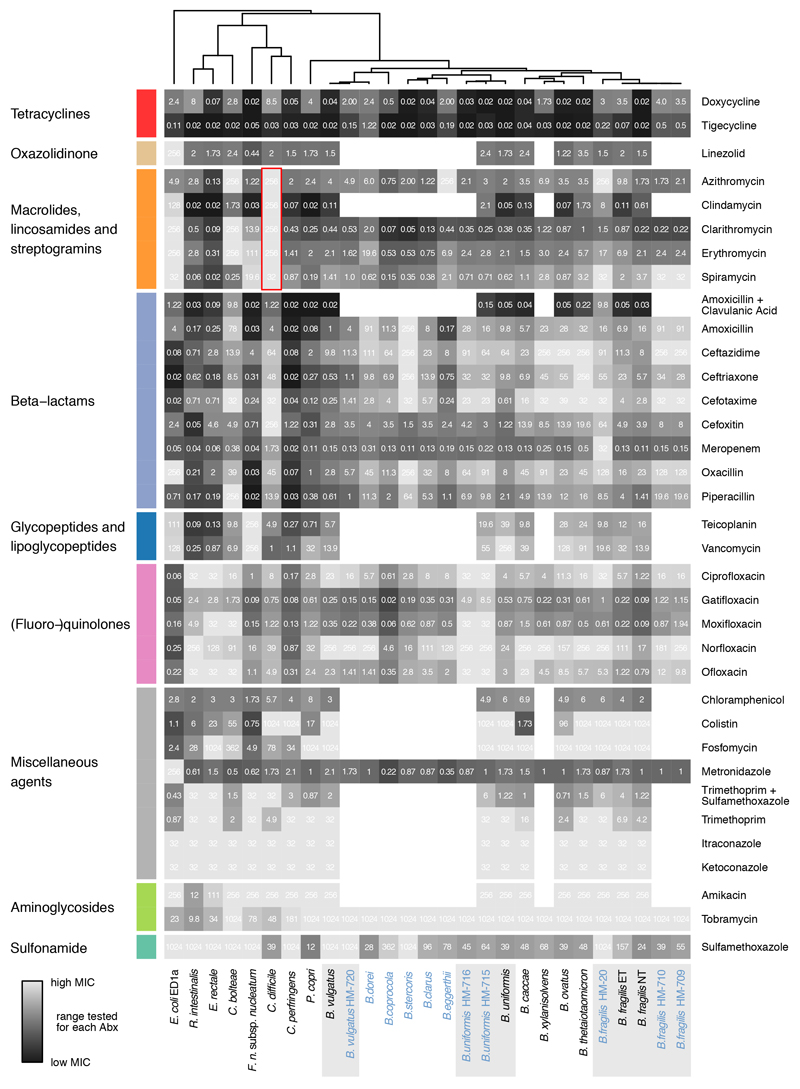
Extended Data Figure 2. MICs for 20 species/27 strains on 35 antimicrobials.
Heat map depicts MICs for each drug-strain pair in μg/ml. Heat map color gradient is adjusted to the MICs concentration range tested on the respective MIC test strip. Black depicts sensitivity and light grey resistance. Mean values across two biological replicates are shown (Suppl. Table 4). The species/strains from the screen are shown in black, additional strains to investigate intraspecies and intragenus variation within the Bacteroides genus are shown in blue. The grey background indicates that several strains per species were tested. Of note, C. difficile is particularly resistant to all tested macrolides and clindamycin (red box).

