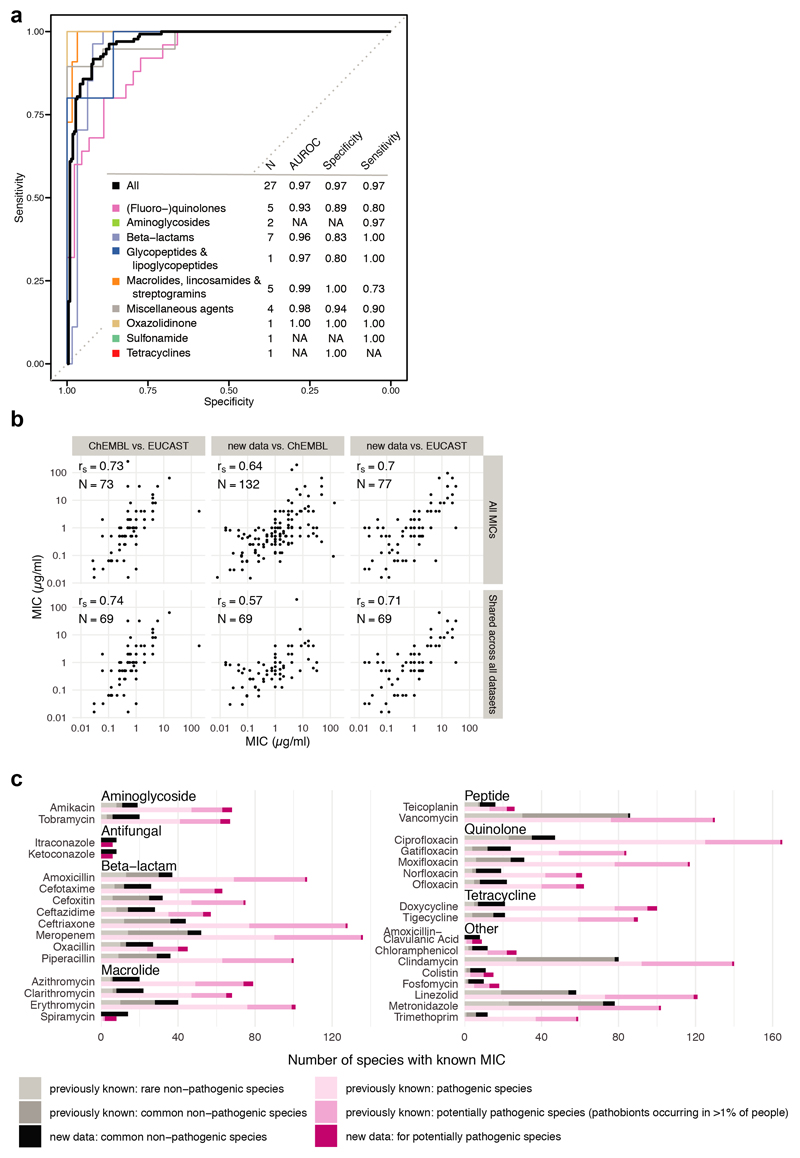
Extended Data Figure 3. MIC dataset validates antibiotic sensitivity profiles from the screen and is consistent with publically available MICs.
a. Receiver operating characteristic (ROC) curve analysis was performed to evaluate sensitivity and specificity of the screen2 using the MIC dataset. Results from the screen were considered as validated if MICs were below/above the 20 μM antibiotic concentration that was tested in the screen (allowing a two-fold error margin). N is the number of antibiotics that we tested both in the screen and determined MICs for; AUROC is the area under the characteristic ROC. TN denotes true negatives, FP false positives, TP true positives, FN false negatives.
b. Comparison including Spearman correlation coefficients of the MICs from this study to MICs from the ChEMBL19 and EUCAST16 databases. Panels in the upper row: comparison between all MICs that are shared between the two indicated datasets. Panels in the lower row: comparison of the 69 MICs that are shared across all three datasets. Despite experimental differences, our MICs correlate well with available EUCAST/ChEMBL data.
c. Number of the sum of new (this study) and already available MICs (EUCAST/ChEMBL) per drug according to antibiotic class and prevalence/virulence of the bacterial species. The new dataset expands MICs across the board and specifically fills the knowledge gap on non-pathogenic species.

