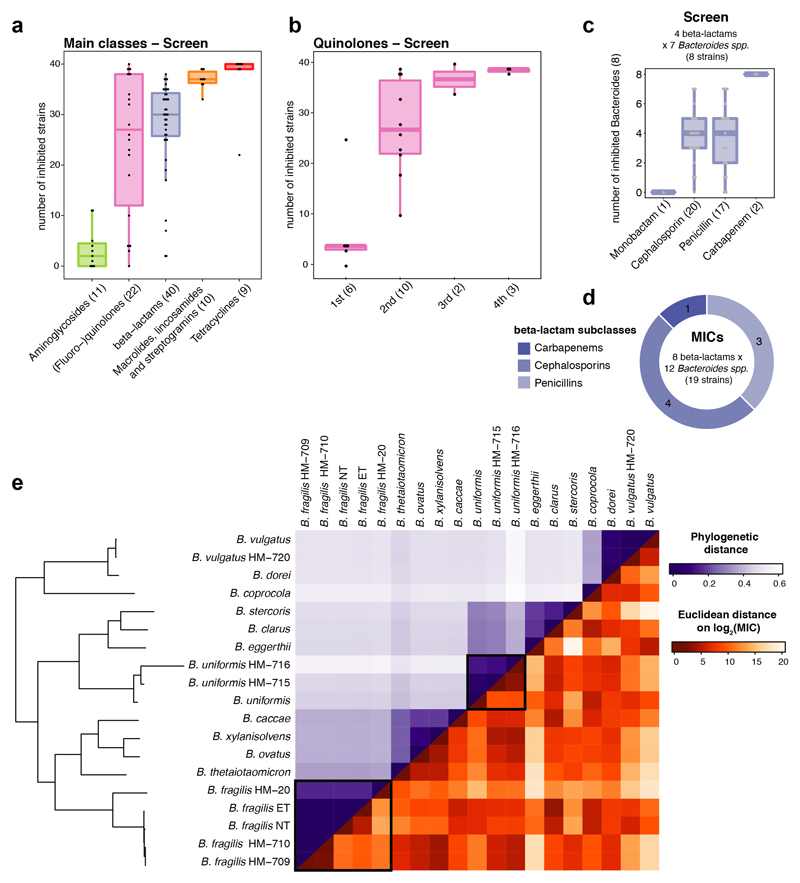
Extended Data Figure 4. Antibiotic classes exhibit distinct behaviours in gut bacterial species.
a. Number of inhibited strains per antibiotic class (number of tested drugs per class in brackets). In total 40 strains were tested at a 20 μM antibiotic concentration. Boxes span the IQR and whiskers extend to the most extreme data points up to a max of 1.5 times the IQR.
b. Number of inhibited strains per (fluoro-)quinolone drug generation. Number of tested drugs per generation is indicated in brackets - boxplots as in a.
c-d. Overview of the number of drugs tested per β-lactam subclasses on Bacteroides species (spp) in screen (c) and for MICs (d).
e. Heat map of phylogenetic relationship between Bacteroides spp (upper triangular matrix) ordered by phylogeny and their resistance profiles across β-lactam antibiotics (lower triangular matrix). Colors represent the pairwise phylogenetic distance and the Euclidean distance on the log2 transformed MICs for β-lactams. Examples of strains from the same species (B. fragilis / B. uniformis) that respond differently to β-lactam antibiotics, are highlighted.

