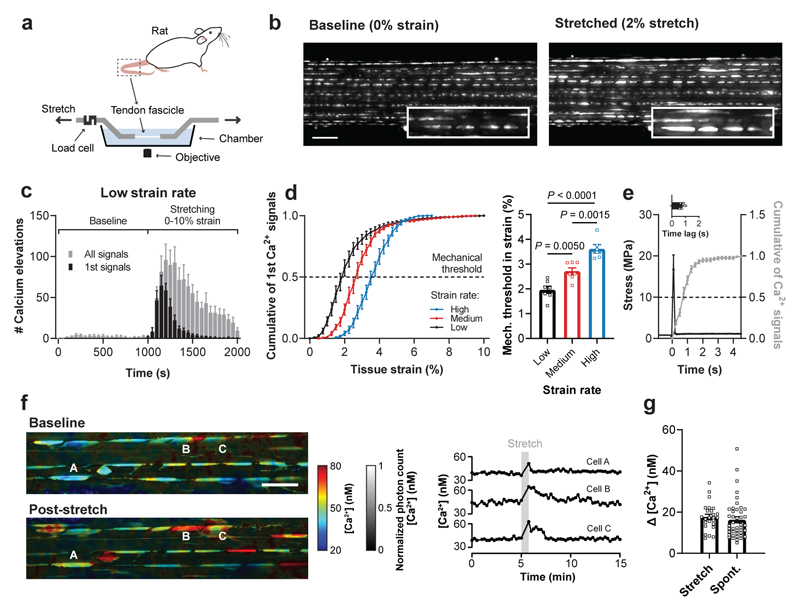
Fig. 1. Mechanically-induced Ca2+ elevations in tissue-resident tenocytes.
a, Schematic of the setup used for simultaneous stretching and Ca2+ imaging of tissue-resident tenocytes labeled with Fluo-4. b, Ca2+ images of a rat tail tendon fascicle at baseline and during the stretching protocol at low strain rate (0.01% strain/s) showing stretch-induced Ca2+ signals (scale bar, 100 μm). c, Quantification of the Ca2+ signals at baseline and during the stretching protocol at low strain rate (n=7 fascicles). d, The cumulative sum of the first Ca2+ signals for three different strain rates (low 0.01% strain/s, medium 0.1% strain/s and high 1.0% strain/s) showing a right-shift with increasing strain rate. The mechanical threshold was defined at 50% of the cumulative curve and corresponds to the tissue strain at which 50% of the cells showed a first Ca2+ signal. Mechanical thresholds were found at (from low to high strain rate): 1.96±0.35% strain (n=7 fascicles), 2.72±0.33% strain (n=7 fascicles) and 3.62±0.38% strain (n=6 fascicles), one-way ANOVA with multiple comparisons (Tukey’s test). e, Quantification of the time lag between mechanical stimulus and Ca2+ elevation (n=5 fascicles). f, FLIM acquired images of OGB-1-labelled tenocytes in a rat tail tendon fascicle showing [Ca2+] landscapes at baseline and post-stretch (scale bar, 50 μm). Corresponding time traces of [Ca2+] for three cells (indicated with letters in the images). g, Quantification of the increases in [Ca2+], represented as Δ [Ca2+], between baseline and active state for stretch-induced Ca2+ signals (n=25 cells from 6 fascicles) and spontaneous Ca2+ signals (n=43 cells from 13 fascicles). Replicates are biological. Data are means±SEM.

