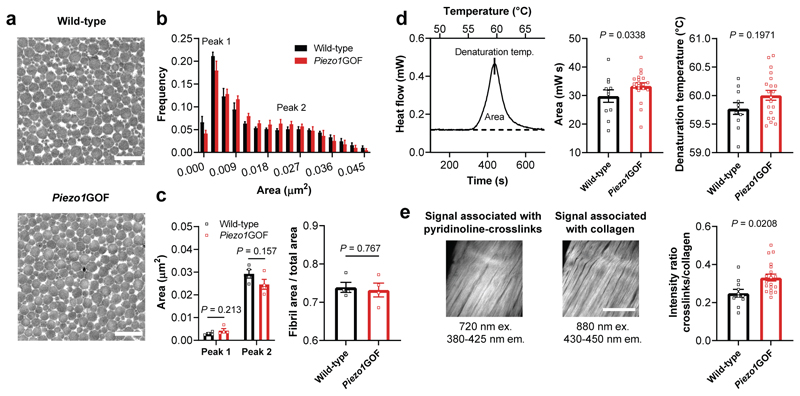
Fig. 6. Unchanged collagen fibrils but increased crosslink-associated thermal stability and autofluorescence in load-bearing tendons from Piezo1GOF mice.
a, Transmission electron microscopy (TEM) images showing the collagen fibrils in plantaris tendons from a Piezo1GOF mouse and a wild-type littermate (scale bar, 500 nm). b, Quantification of the collagen fibril area from TEM images of plantaris tendons shows a similar frequency distribution between Piezo1GOF mice and wild-type littermates. An average of around 23’600 collagen fibrils were analyzed per tendon (one tendon per mouse, n=4 mice per genotype). c, No differences were observed in the two local peaks determined with a fit of the frequency distribution (n=4 mice per genotype, multiple t-tests). Also the tissue compactness, measured as the ratio between fibril area and total area, was similar between plantaris tendons from Piezo1GOF mice and wild-type littermates (n=4 mice per genotype, unpaired Student’s t-test). d, Differential scanning calorimetry measurements with Achilles tendons demonstrate an increased transition enthalpy, corresponding to the area between the denaturation curve and baseline (shown as a dashed line), in Piezo1GOF mice (n=10 mice, 8 heterozygous and 2 homozygous) compared to wild-type littermate controls (n=6 mice). e, Two-photon imaging of Achilles tendons was used to assess the autofluorescence associated with the collagen crosslinks pyridinoline, and the second harmonic generation signal associated with the collagen matrix46, n=11 Piezo1GOF mice (8 heterozygous and 3 homozygous) and n=7 wild-type littermate mice, (scale bar, 100 μm). Unless indicated otherwise, statistics was performed with linear mixed effects models (mouse ID as random effect and litter as fixed effect). Replicates are biological. Data are means±SEM.

