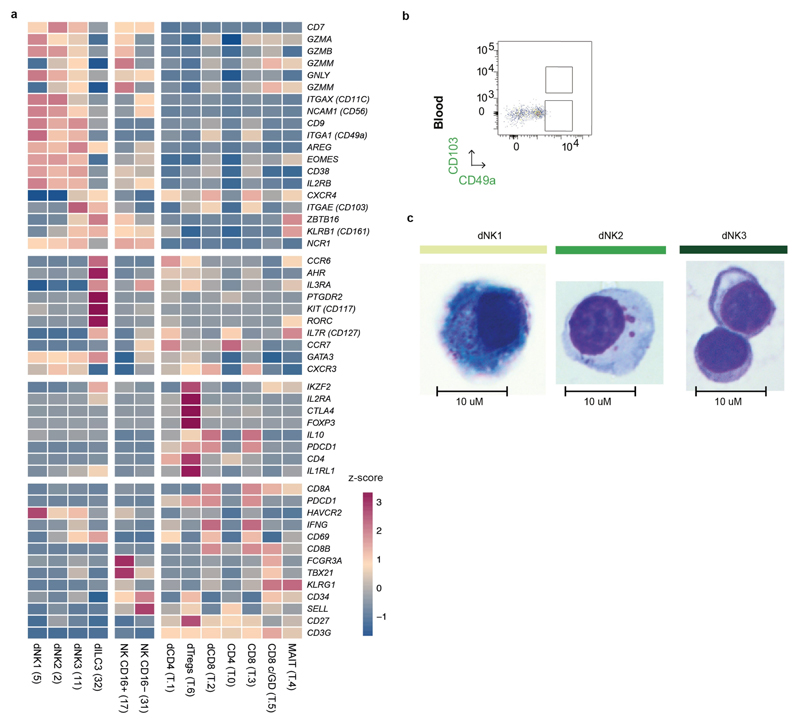
Extended Data Fig. 8. Lymphocyte populations in the decidua.
Heat map showing z-scores of the mean log-transformed, normalized expression of selected genes in the lymphocyte populations. Proliferating dNK cells (dNKp) are excluded from the analysis (n 11 deciduas). b, FACS gating strategy in Fig. 5 applied in matched blood. Matched blood for the sample shown in Fig. 5 (n 2 biological replicates). c, Morphology of dNK1, dNK2 and dNK3 subsets by Giemsa–Wright stain after cytospin (representative data from 1 of n 2 biological replicates are shown). Scale bar, 10 m.

