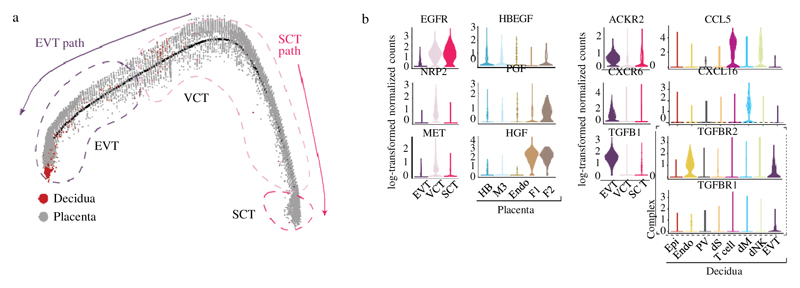
Fig. 2. Ligand–receptor expression during EVT differentiation.
a, Pseudotime ordering of trophoblast cells reveals EVT and SCT pathways. Enriched EPCAM and HLA-G cells on placental and decidual isolates are included. n 11 deciduas and n 5 placentas. b, Violin plots showing log-transformed, normalized expression levels for selected ligand–receptor pairs that change during pseudotime and are predicted to be significant by CellPhoneDB (EGFR, HBEGF, NRP2, PGF, MET, HGF, ACKR2, CCL5, CXCR6, CXCL16, TGFB1, TGFBR2 and TGFBR1). Cells from Fig. 1c are used for the violin plots.

