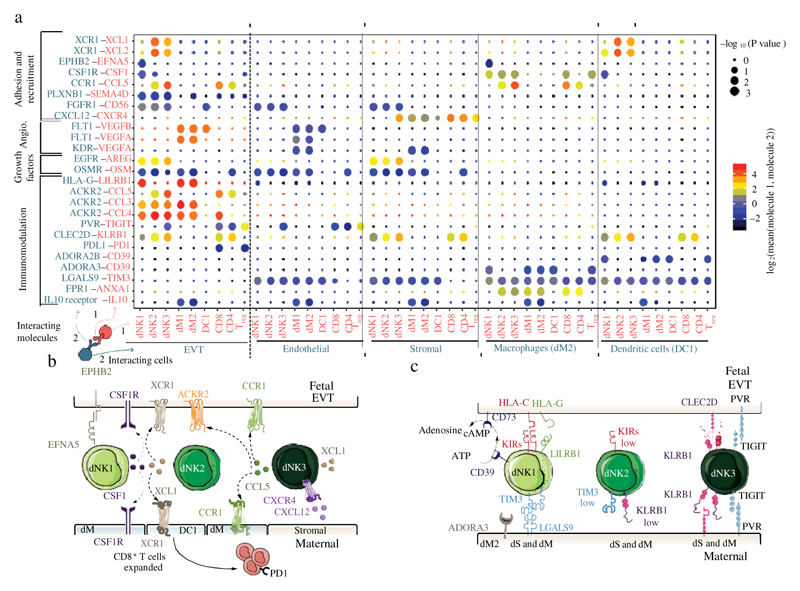
Fig. 5. Multiple regulatory immune responses at the site of placentation.
a, Overview of selected ligand–receptor interactions; P values indicated by circle size, scale on right (permutation test, see Methods). The means of the average expression level of interacting molecule 1 in cluster 1 and interacting molecule 2 in cluster 2 are indicated by colour. Only droplet data were used (n 6 deciduas). Angio., angiogenesis. Assays were carried out at the mRNA level, but are extrapolated to protein interactions. b, Diagram of the main receptors and ligands expressed on the three dNK subsets that are involved in adhesion and cellular recruitment. c, Diagram of the main receptors and ligands expressed on the three dNK subsets that are involved in immunomodulation.

