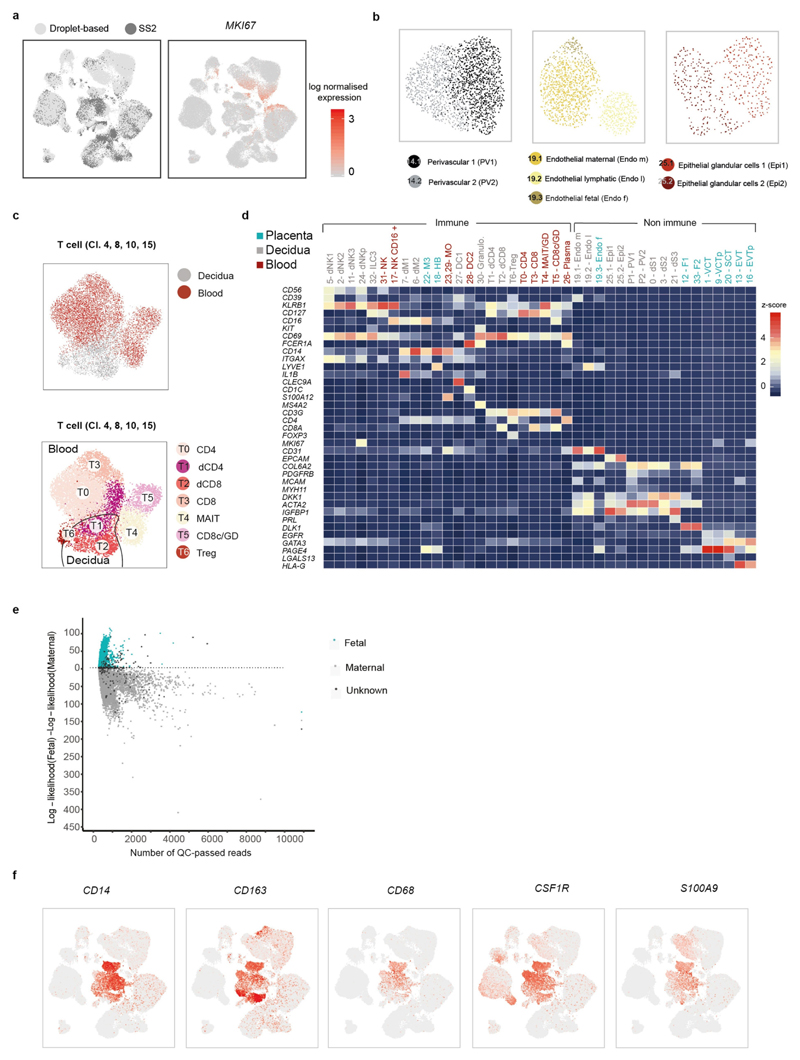
Extended Data Fig. 3. Overview of droplet and Smart-seq2 datasets.
a, UMAP plot showing the integration of the Smart-seq2 and droplet-based dataset and the log-transformed expression of MKI67 (which marks proliferating cells). b, UMAP plots showing the separate and more-detailed integration analysis of the cells from cluster 14 (perivascular cells), cluster 19 (endothelial cells) and cluster 25 (epithelial cells). Clusters are labelled as in Fig. 1c. c, UMAP visualization of T cell clusters obtained by integrating Smart-seq2 and droplet-based T cells subpopulations (clusters 4, 8, 10 and 15) from Fig. 1c. Cells are coloured by the tissue of origin (top) and the identified clusters (bottom). d, Heat map showing the z-score of the mean log-transformed, normalized counts for each cluster of selected marker genes used to annotate clusters. For a more extensive set of genes, see Supplementary Table 2. Adjusted P value 0.1; Wilcoxon rank-sum test with Bonferroni correction. NK, natural killer cells; NKp, proliferating natural killer cells; MO, monocytes; Granulo, granulocytes; Treg, regulatory T cells; GD, T cells; CD8c, cytotoxic CD8 T cells; Plasma, plasma cells. e, log-likelihood differences between assignment to fetal versus assignment to maternal origin of cells, on the basis of single nucleotide polymorphism calling from the droplet RNA-seq data. Cells are coloured by their assignment as determined by demuxlet. For this figure, we used n 5 placentas, n 6 deciduas and n 4 blood individuals. f, UMAP visualization of the log-transformed, normalized expression of selected marker genes of the M3 subpopulation.

