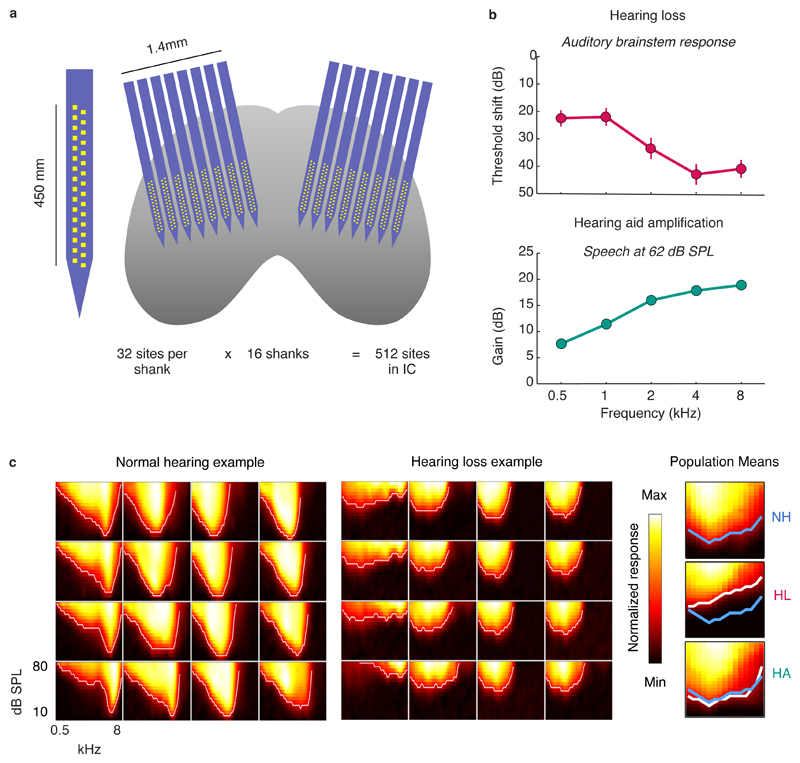
Fig. 1. Large-scale recordings of neural activity from the inferior colliculus with normal hearing and mild-to-moderate hearing loss.
a, Schematic diagram showing the geometry of custom-designed electrode arrays for large-scale recordings in relation to the inferior colliculus in gerbils. b, Threshold shifts with hearing loss and corresponding hearing aid amplification. Top: Hearing loss as a function of frequency in noise-exposed gerbils (mean ± standard error, n = 20). The values shown are the ABR threshold shift relative to the mean of all gerbils (n = 15) with normal hearing. Bottom: Hearing aid amplification as a function of frequency for speech at 62 dB SPL with gain and compression parameters fit to the average hearing loss after noise exposure. The values shown are the average across 5 minutes of continuous speech. c, MUA recorded in the inferior colliculus during the presentation of tones. Left, The MUA FRAs for 16 channels from a normal hearing gerbil. Each subplot shows the average activity recorded from a single channel during the presentation of tones with different frequencies and intensities. The colormap for each plot is normalized to the minimum and maximum activity level across all frequencies and intensities. Middle: MUA FRAs for 16 channels from a gerbil with hearing loss. Right, The average MUA FRAs across all channels from all gerbils for each hearing condition. The lines indicate the lowest intensity for each frequency at which the mean MUA was more than 3 standard deviations above the mean MUA during silence. The line for normal hearing is shown in blue on all three subplots.

