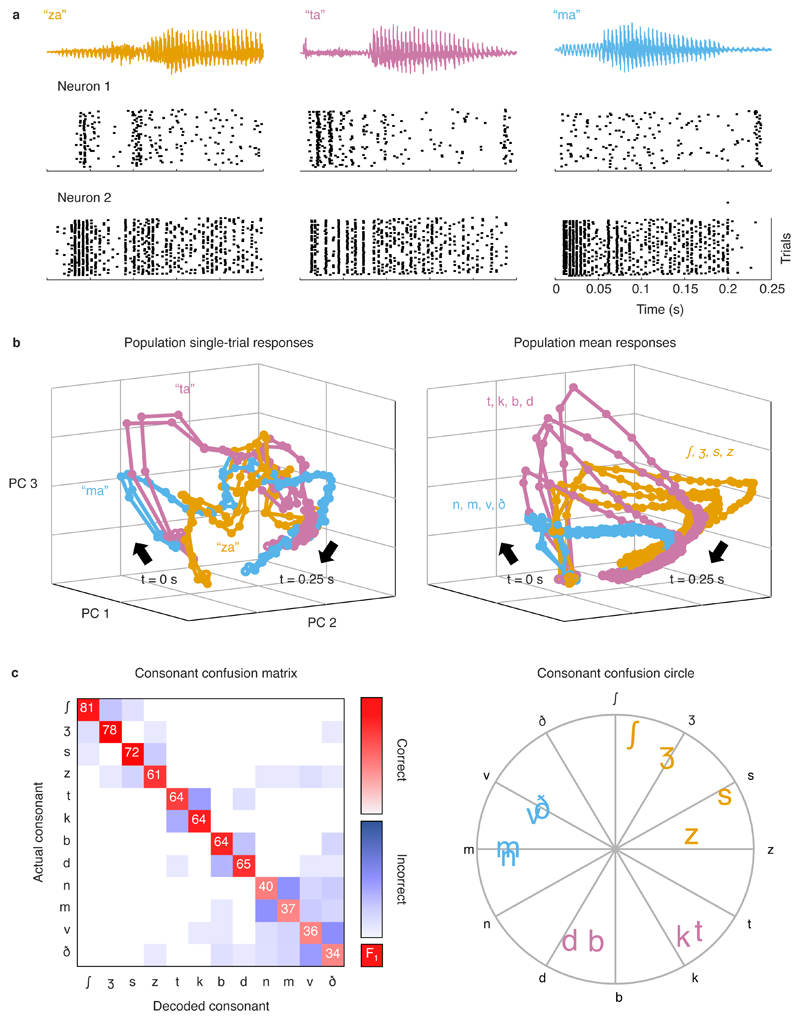
Fig. 2. Single-trial responses to speech can be classified with high accuracy.
a, Single-unit responses to speech. Each column shows the sound waveform for one instance of a syllable and the corresponding raster plots for repeated presentations of that syllable for two example neurons from a gerbil with normal hearing. b, Left, Low-dimensional visualization of population single-trial responses to speech. Each line shows the responses from all neurons from all gerbils with normal hearing after principal component decomposition and projection into the space defined by the first three principal components. Responses to two repeated presentations for each of three syllables (indicated by the three colours) are shown. The time points corresponding to syllable onset are indicated by t = 0 s. Right, Low-dimensional visualization of mean population response to each consonant. Each line shows responses as in b after averaging across all presentations of syllables with the same consonant. Mean responses to each of 12 consonants are shown, with colours corresponding to consonant categories: sibilant fricatives (orange), stops (pink), and nasals and non-sibilant fricatives (blue). c, Performance and confusion patterns for a support-vector-machine classifier trained to identify consonants based on population single-trial responses to speech at 62 dB SPL. Left, Each row shows the frequency with which responses to one consonant were identified as that consonant (diagonal entries) or other consonants (off-diagonal entries) by the classifier. The values on the diagonal entries are the F1 score computed as 2 x (precision x recall)/(precision + recall), where precision = true positives/(true positives + false positives) and recall = true positives/(true positives + false negatives). The values shown are the average across all populations. Right, Consonants were assigned angles along a unit circle (indicated by black letters). For each single-trial response for a given actual consonant, a vector was formed with magnitude 1 and angle corresponding to the consonant that the response was identified as by the classifier. The positions of the coloured letters indicate the sum of these vectors across all responses for each consonant.

