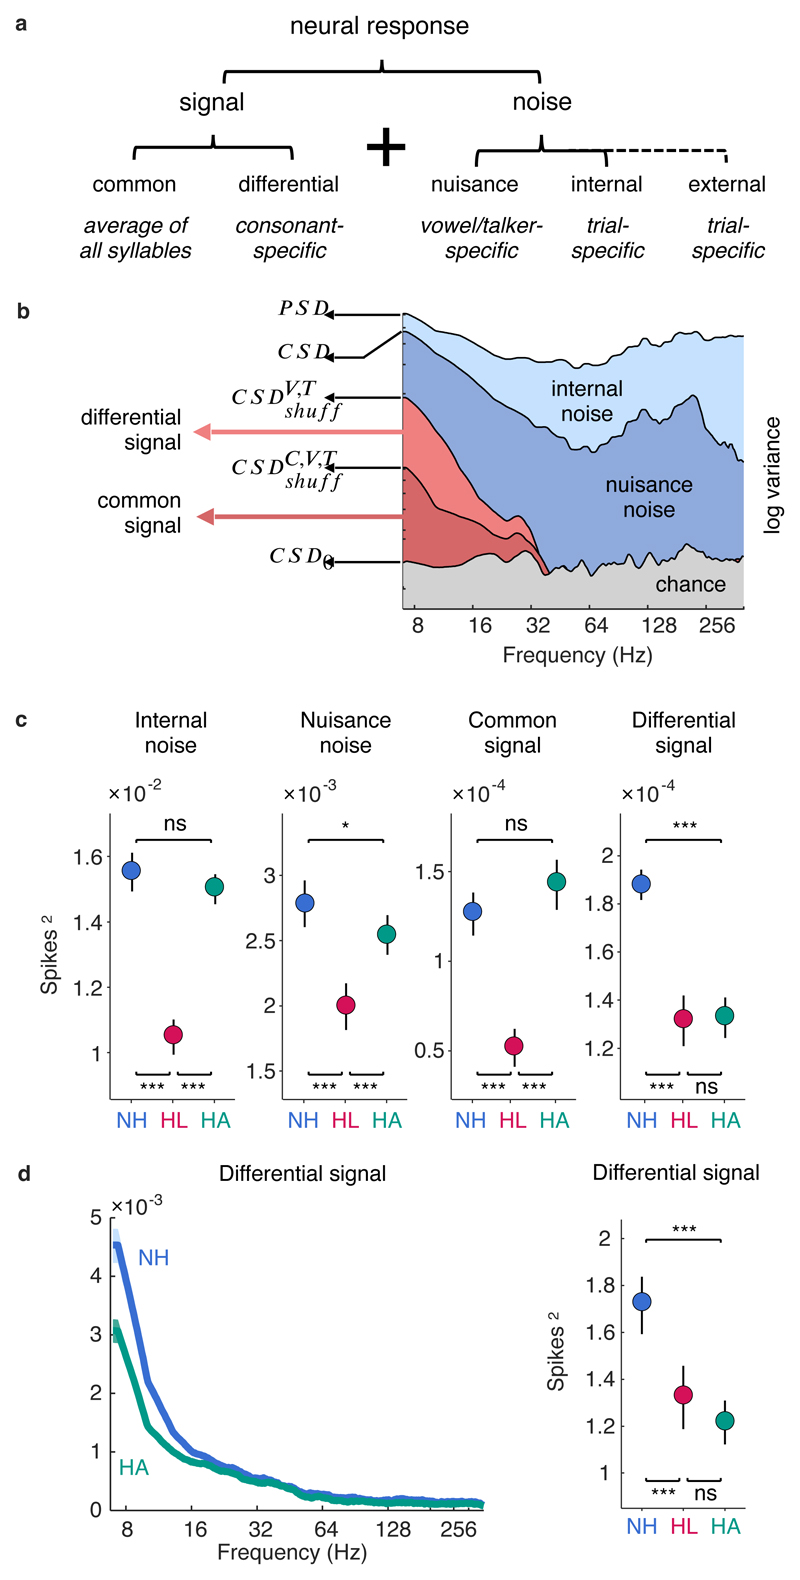
Fig. 4. Hearing aids fail to restore the selectivity of neural responses to speech.
a, The different signal and noise components of neural responses in the context of a consonant identification task. b, Spectral decomposition of responses for an example neuron. Each line shows a power spectral density or cross spectral density computed from responses before and after different forms of shuffling, and each filled area indicates the fraction of the total response variance corresponding to each response component. The superscripts C, V, and T denote consonants, vowels, and talkers, respectively. CSD0 was computed after shuffling and phase randomization in the spectral domain. c, Magnitude of different response components for single-unit responses to speech at 62 dB SPL. Results are shown for neurons from normal hearing gerbils (NH) and gerbils with hearing loss without (HL) and with (HA) a hearing aid (mean ± 95% confidence intervals derived from bootstrap resampling across neurons). d, Left, Magnitude of the differential signal component as a function of frequency for single-unit responses to speech at 62 dB SPL (mean ± 95% confidence intervals derived from bootstrap resampling across neurons indicated by shaded regions). Right, Magnitude of the differential signal component for single-unit spike counts (the total number of spikes in the response to each syllable) for speech at 62 dB SPL, presented as in c.

