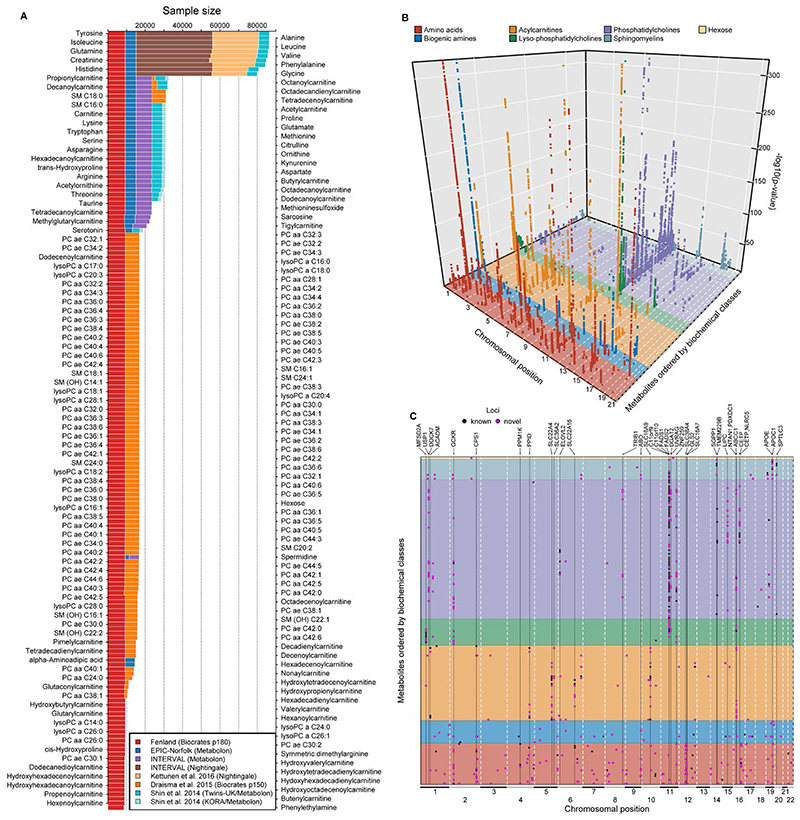
Figure 1.
A Sample size by contributing study and technique for each of the 174 metabolites included. B A three-dimensional Manhattan plot displaying chromosomal position (x-axis) of significant associations (p <4.9×10⁻¹⁰, z-axis) across all metabolites (y-axis). Colours indicate metabolite groups. C A top view of the 3D-Manhattan plot. Dots indicate significantly associated loci. Colours indicate novelty of metabolite – locus associations. Loci with indication for pleiotropy have been annotated.

