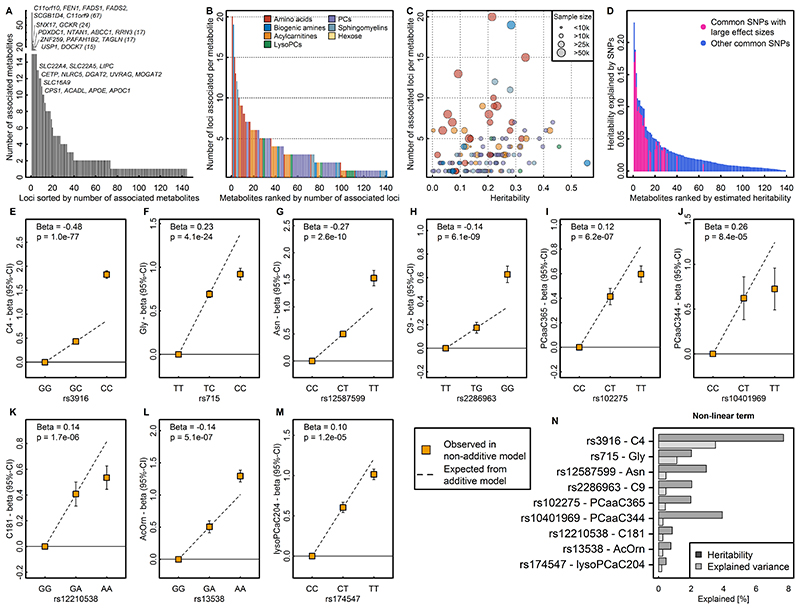
Figure 2.
A Distribution of pleiotropy, i.e. number of associated metabolites, among loci identified in the present study. B Distribution of polygenicity of metabolites, i.e. number of identified loci for each metabolite under investigation. C Scatterplot comparing the estimated heritability of each metabolite against the number of associated loci. Size of the dots indicates samples sizes. D Heritability estimates for single metabolites. Colours indicate the proportion of heritability attributed to single nucleotide polymorphisms (SNPs) with large effect sizes (β>0.25 per allele). E – M SNP – metabolite association with indication of non-additive effects. Beta is an estimate from the departure of linearity. N Barplot showing the increase in heritability and explained variance for each SNP – metabolite pair when including non-additive effects.

