Figure 5.
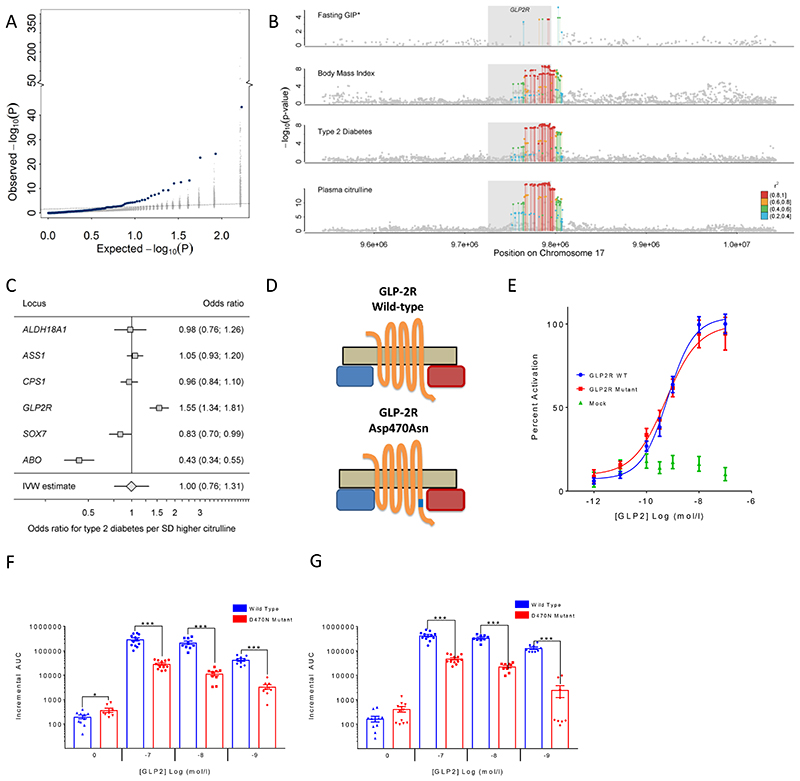
A Enrichment of associations with type 2 diabetes (T2D: 80,983 cases, 842,909 controls) among metabolite-associated SNPs. Blue dots indicate metabolite-SNPs and grey dots indicate a random selection of matched control SNPs. B Regional association plots for plasma citrulline, type 2 diabetes, body mass index, and fasting levels of glucose-dependent insulinotropic peptide (GIP) focussing on the GLPR2 gene. Variants are coloured based on linkage disequilibrium with the lead variant (rs17681684) for plasma citrulline. *Summary statistics for GIP were obtained from the more densely genotyped study included in Almgren et al.24 (to increase coverage of genetic variants for multi-trait colocalisation). C Individual association summary statistics for all citrulline associated SNPs (coded by the citrulline increasing allele) for T2D and an inverse-variance weighted (IVW) estimate pooling all effects. D Schematic sketch for the location of the missense variant induces amino acid substitution in the glucagon-like peptide-2 receptor (GLP2R). E GLP-2 dose response curves in cAMP assay for GLP2R wild-type and mutant receptors. The dose response curves of cAMP stimulation by GLP-2 in CHO K1 cells transiently transfected with either GLP2R wild-type or mutant constructs. Data were normalised to the wild-type maximal and minimal response, with 100% being GLP-2 maximal stimulation of the wild-type GLP2R, and 0% being wild-type GLP2R cells with buffer only. Mean ± standard errors are presented (n=4).F-G Summary of wild-type and mutant GLP2R beta-arrestin 1 and beta-arrestin 2 responses. Area under the curve (AUC) summary data (n=3-4) displayed for beta-arrestin 1 recruitment (E) and beta-arrestin 2 recruitment (F). AUCs were calculated using the 5 minutes prior to ligand addition as the baseline value. Mean ± standard errors are presented. Normal distribution of log10 transformed data was determined by the D'Agostino & Pearson normality test. Following this statistical significance was assessed by one-way ANOVA with post hoc Bonferroni test. ***p<0.001, *p<0.05.

