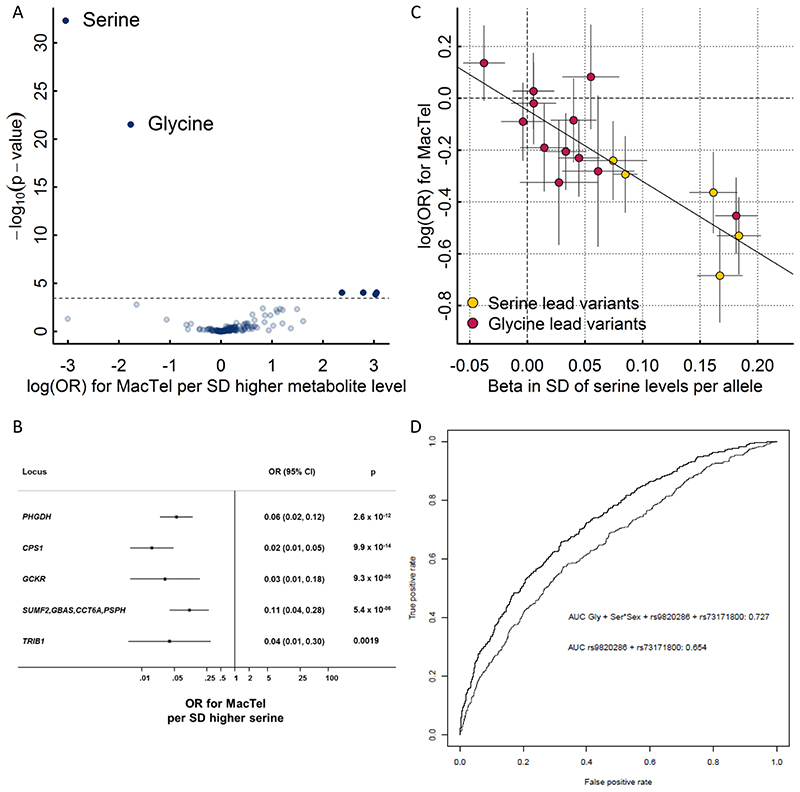
Figure 6.
A Results from genetic scores for each metabolite on risk for macular telangiectasia type 2 (MacTel). The dotted line indicates the level of significance after correction for multiple testing. The inlet shows the same results but after dropping the pleiotropic variants in GCKR and FADS1-2. B Effect estimates of serine-associated genetic variants on the risk for MacTel. C Comparison of effect sizes for lead variants associated with plasma serine levels and the risk for MacTel. D Receiver operating characteristic curves (ROC) comparing the discriminative performance for MacTel using a) sex, the first genetic principal component, and two MacTel variants (rs73171800 and rs9820286) not associated with metabolite levels, and b) additionally including genetically predicted serine and glycine at individual levels as described in the methods. The area under the curve (AUC) is given in the legend.

