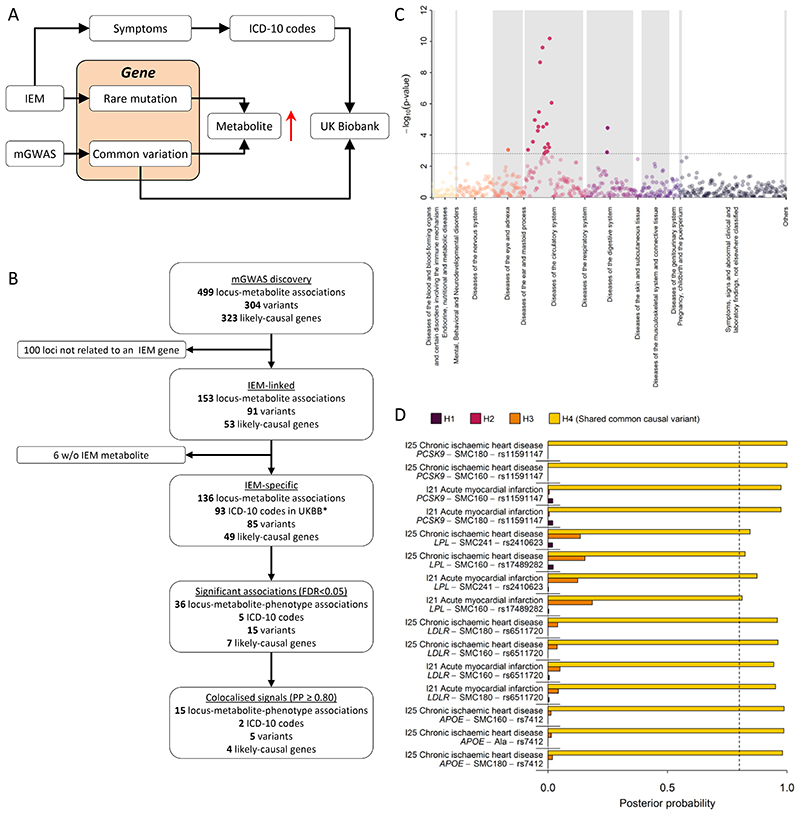
Figure 7.
A Scheme of the workflow to link common variation in genes causing inborn errors of metabolism (IEM) to complex diseases. 7B Flowchart for the systematic identification of metabolite-associated variants to genes and diseases related to inborn errors of metabolism (IEM). C P-values from phenome-wide association studies among UK Biobank using variants mapping to genes knowing to cause IEMs and binary outcomes classified with the ICD-10 code. Colours indicate disease classes. The dotted line indicates the significance threshold controlling the false discovery rate at 5%. D Posterior probabilities (PPs) from statistical colocalisation analysis for each significant triplet consisting of a metabolite, a variant, and a ICD-10 code among UK Biobank. The dotted line indicates high likelihood (>80%) for one of the four hypothesis tested: H0 – no signal; H1 – signal unique to the metabolite; H2 – signal unique to the trait; H3 – two distinct causal variants in the same locus and H4 – presence of a shared causal variant between a metabolite and a given trait.

