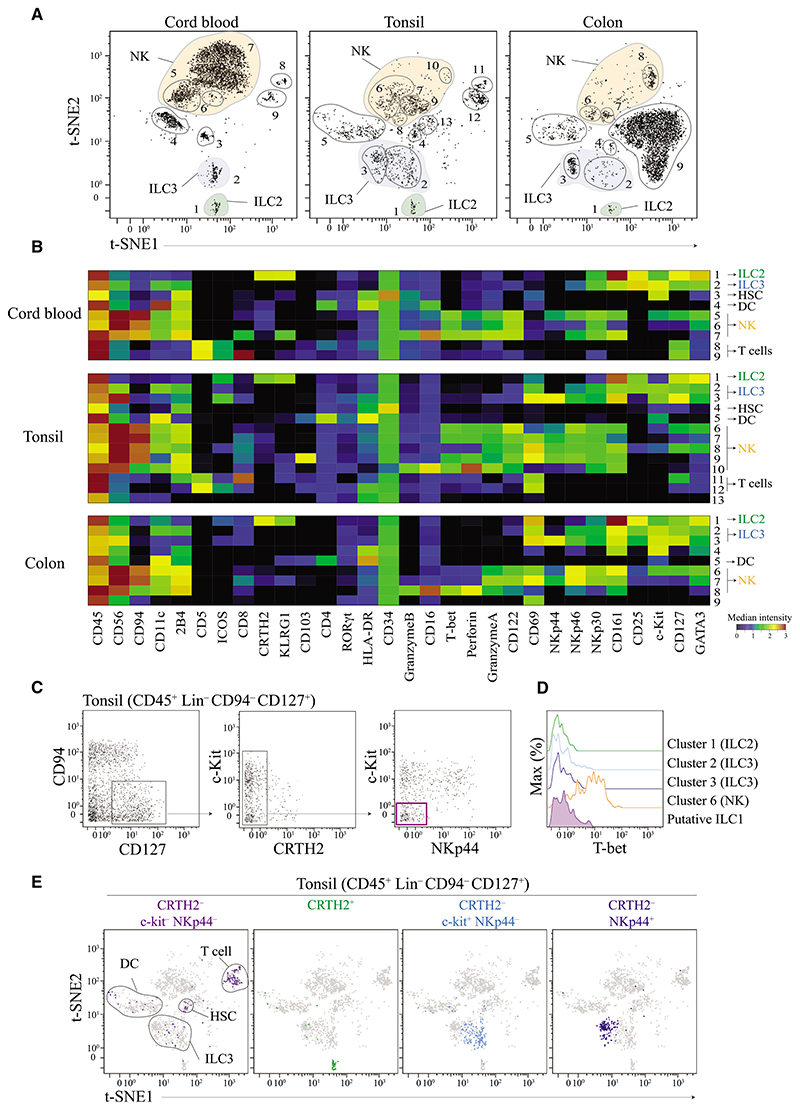
Figure 1. t-SNE Analysis Objectively Delineates ILCs Populations—with the Exception of ILC1 Cells.
(A) Visualized t-SNE map of cells isolated from cord blood, tonsil, and colon tissue. t-SNE was performed after depleting B and T cells and gating on live CD45+ Lin− (FcεR1α− CD14− CD19− CD123−, see Figure S1A for gating strategy). Clusters (cells populations) were identified by manual gating. Data shown are representatives of one donor per tissue from 3 to 10 independent experiments.
(B) Based on the clusters identified in (A), median intensities for each of the marker were calculated and plotted as a heatmap to identify the respective ILC populations. Data shown are from donor represented in (A).
(C) Identification of putative ILC1 cells using standard bi-axial gating (CD45+ Lin− CD94− CD127− CRTH2− c-Kit− NKp44−) from tonsil. Data shown are from donor represented in (A).
(D) Histogram of T-bet expression by putative ILC1 cells in tonsils. Cell clusters corresponding to ILC2, ILC3, and NK cells were used as controls. Data shown are from donor represented in (A).
(E) Visualization of all different ILC subsets identified by standard bi-axial gating by t-SNE. Data shown are from donor represented in (A).
Please also see Figures S1 and S2.

