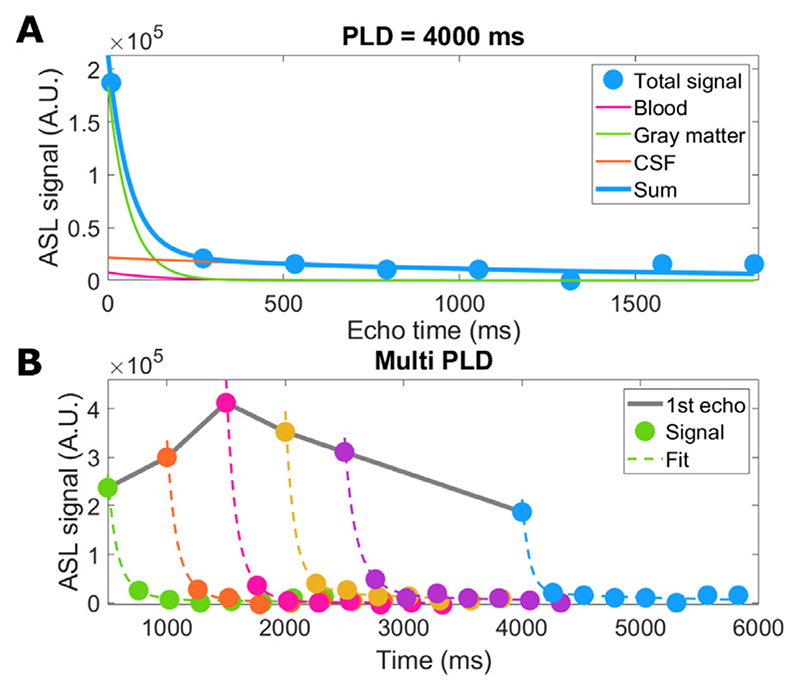
Fig. 2. Example of single-voxel data fitted to the triexponential model.
A shows the separation of the signal into three exponentials with T2 = 60 ms (GM), 150 ms (blood), and 1500 ms (CSF) for a single time point. B shows the fit to the sum of these three exponential components for all time points. Note that there are no error-bars as this dataset provided a single value for each voxel (any averaging over shots was done in image reconstruction).

