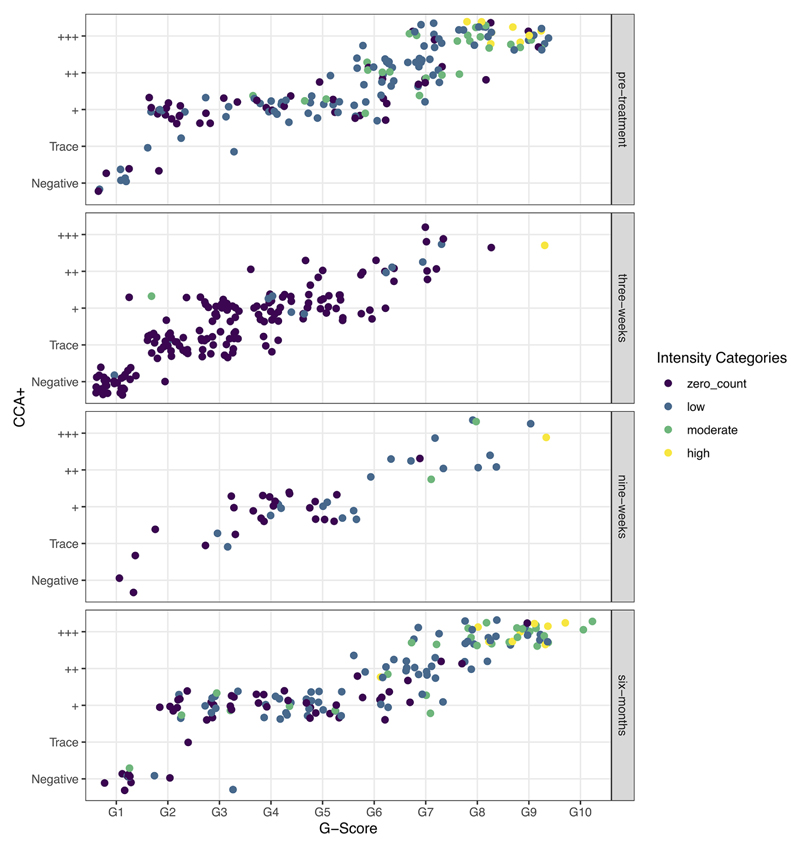
Figure 1.
Raw data showing the correlation between G-Scores and POC-CCA+ colored by the WHO Schistosoma mansoni infection-intensity categories, as determined by Kato-Katz egg counts, and split by the timesteps used in the models: pre-treatment, and three-weeks, nine-weeks and six-months post-treatment.

