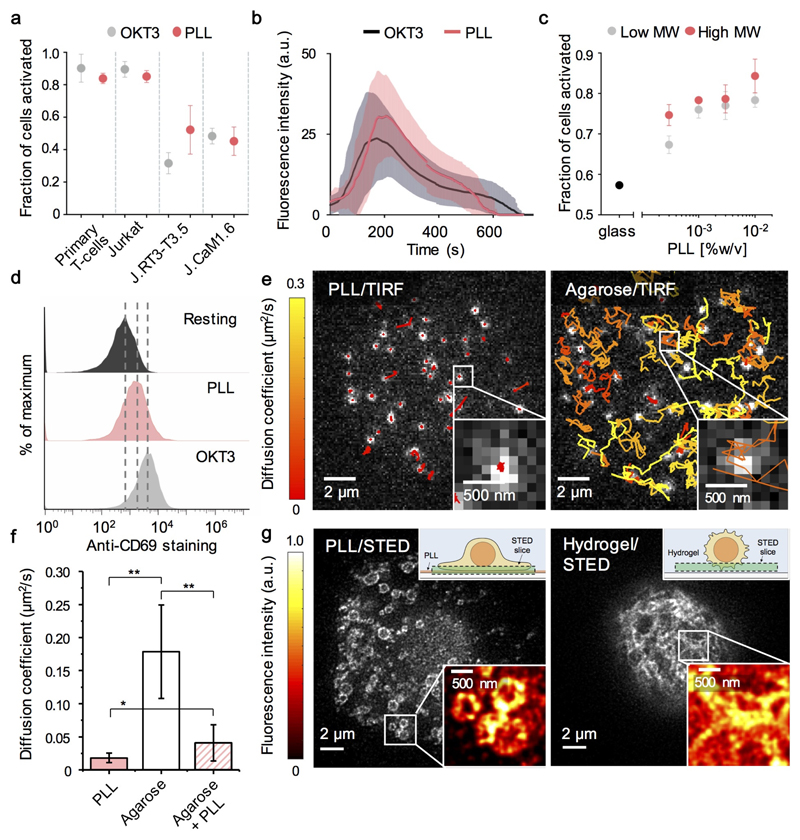
Figure 1. PLL induces strong T-cell signaling and profoundly alters TCR diffusional behavior and organization.
(a) Fraction of primary (CD4+) and wild-type and mutant Jurkat T-cells eliciting calcium responses (detected with Fluo-4AM) upon contact with OKT3- (grey)- and PLL- (red) coated surfaces. Mean ± s.d. are shown for three experiments. (b) Fluo-4AM fluorescence intensity changes versus contact time for Jurkat T-cells on OKT3- (grey) or PLL- (red) coated surfaces (mean, solid lines; s.d., shaded area) were calculated for N=100 randomly chosen cells per condition. (c) Fraction of responding Jurkat T-cells as PLL coating-concentration is varied, for high (red, i.e. 150 kDa) and low (grey, i.e. 70 kDa) molecular weight (MW) PLL. Mean ± s.d. are shown for three experiments. (d) Surface expression of CD69 on cultured Jurkat T-cells (black), and after overnight incubation on PLL- (red) or OKT3- (grey) coated surfaces. Data are representative of three experiments. (e) Single-molecule, TIRF-based tracking of fluorescent Fab-labelled TCRs at basal surfaces of Jurkat T-cells contacting PLL- (left) or agarose- (right) coated surfaces. Tracks are coloured by diffusion coefficient (MSD analysis; colour bar). (f) TCR diffusion coefficients from single-molecule tracking for each cell calculated from ensemble average MSD curves; means ± s.d. for cell-to-cell variation are shown; *, p<0.001; **, p<1x10⁻¹⁰. (g) STED images of TMR-Halo labelled TCRs at basal surfaces of Jurkat T-cells contacting a PLL-coated glass surface (left) or suspended in hydrogel (right). Insets: diagrams of the experimental setup (upper right corners), and fluorescence intensity variation in the marked-up areas (lower right corners).

