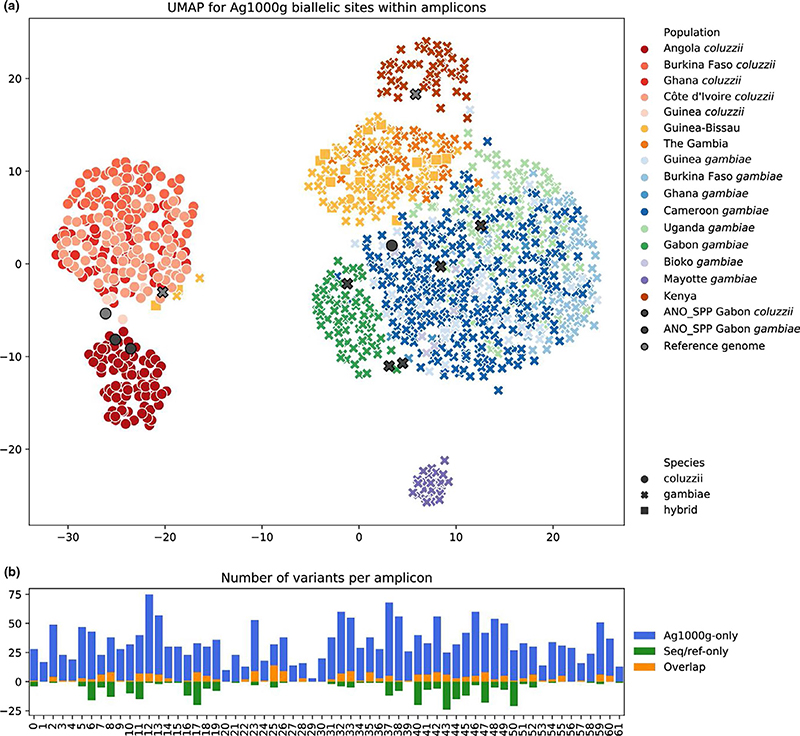
Figure 4. Population structure determined using the amplicon panel.
(a) UMAP dimensionality reduction on biallelic sites of Ag1000g Phase 2 data set of 1142 An. gambiae and An. coluzzii samples overlapping with positions of 62 amplicons with added amplicon sequencing samples (ANO_SPP) and reference genomes. Colours indicate populations and species, shapes indicate species. (b) Variant counts per amplicon for An. gambiae and An. coluzzii samples (seven amplicon sequenced, three reference genomes) compared to Ag1000g Phase 2 biallelic sites (1142 samples)

