. 2022 Apr 10;28(13):2911–2922. doi: 10.1158/1078-0432.CCR-21-1643

Figure 3.

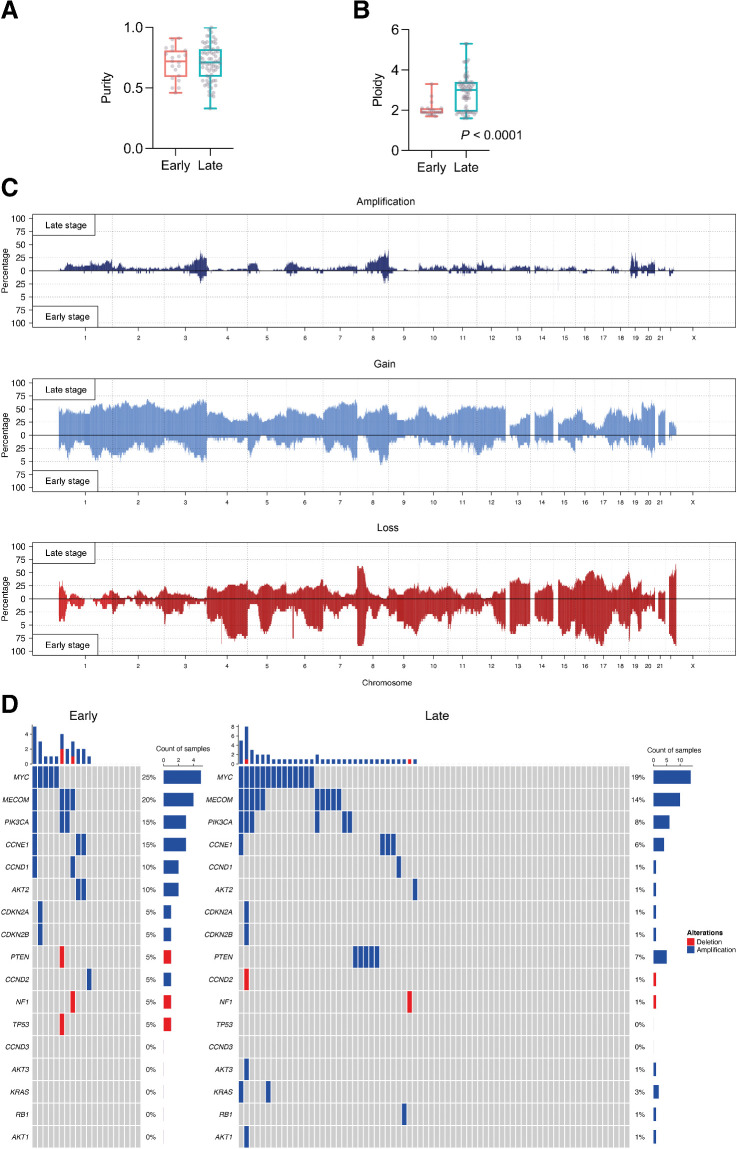
Figure 3. Focal gene amplifications and deletions in early-stage and late-stage cohorts. A, Purity comparison of early-stage and late-stage cohorts. B, Ploidy comparison of early-stage and late-stage cohorts; Mann–Whitney test. C, Global CN amplifications, gains and losses in early-stage and late-stage cohorts. D, Estimation of focal amplifications and deletions in 17 genes of interest, determined by sWGS. The top plot shows the number of amplifications and deletions in each tumor sample.

Focal gene amplifications and deletions in early-stage and late-stage cohorts. A, Purity comparison of early-stage and late-stage cohorts. B, Ploidy comparison of early-stage and late-stage cohorts; Mann–Whitney test. C, Global CN amplifications, gains and losses in early-stage and late-stage cohorts. D, Estimation of focal amplifications and deletions in 17 genes of interest, determined by sWGS. The top plot shows the number of amplifications and deletions in each tumor sample.