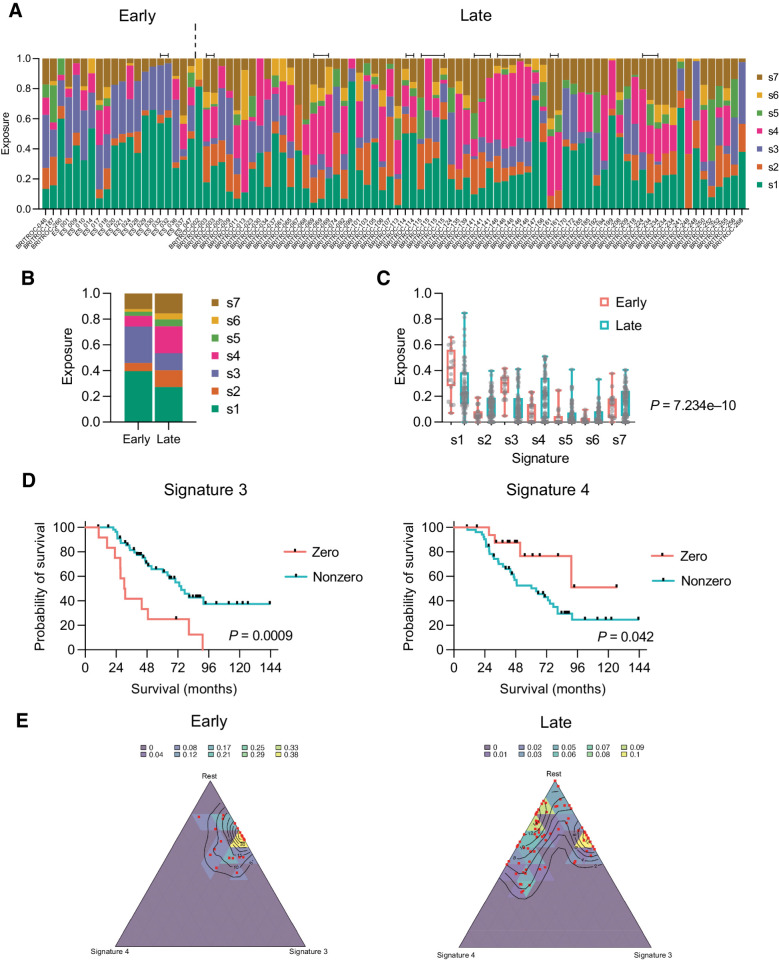
Figure 4.
CN signatures in early-stage and late-stage cohorts. A, CN signature exposures in early-stage and late-stage patients. Note that signature exposures sum to 1 in each sample. Bars above signatures indicate adjacent samples derived from the same patient. B, Mean signature exposure proportions across the early-stage and late-stage cohorts. C, Comparison of signature exposures across early-stage and late-stage cohorts; Wald test. D, Overall survival of combined early-stage and late-stage cohorts by zero versus nonzero exposures to CN signature 3 (left) and 4 (right). Log-rank (Mantel–Cox) analysis. E, Simplex plots representing exposures for CN signature 3 (right axis), signature 4 (bottom axis), and the rest of the signatures (1–S3–S4) combined (left axis) in early-stage (left) and late-stage (right) cohorts. Each red dot represents a single sample, and the contours represent the density of observed samples.

