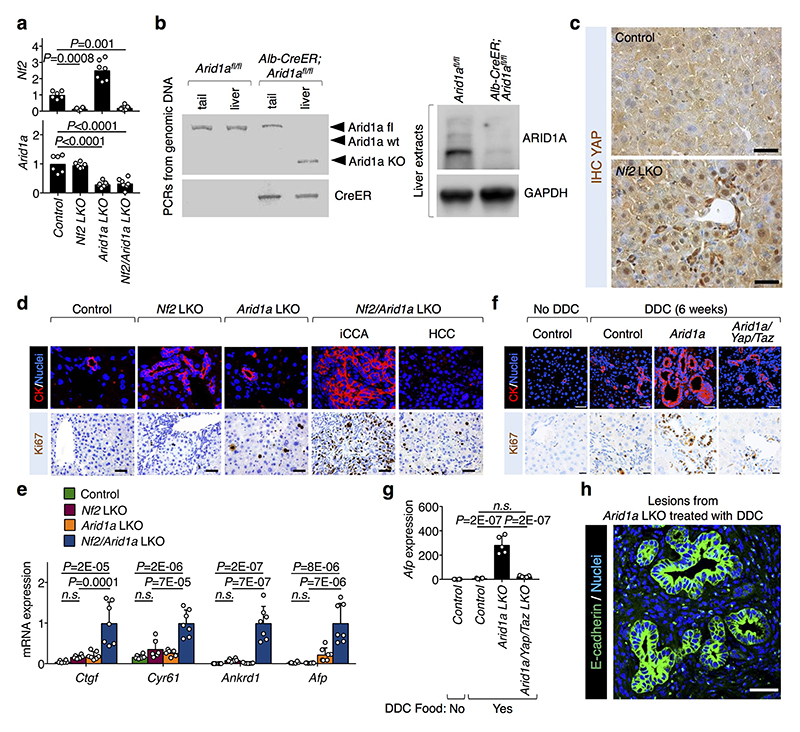
Extended Data Figure. 5. Effect of ARID1A depletion in hepatocytes on tumor formation.
a, qRT-PCR analysis for Nf2 and Arid1a expression (mean + s.d.) in the livers from control (n=6 mice), and Nf2 (n=6 mice), Arid1a (n=7 mice) and Nf2/Arid1a (n=7 mice) liver mutant (LKO) mice, 4 months after tamoxifen treatment. All animals were included.
b, Livers from control (Arid1afl/fl) and Arid1a LKO (Alb-CreER; Arid1afl/fl) mice were harvested 2 weeks after tamoxifen treatment, and genomic DNA and proteins were extracted with standard procedures. Panels are representative results, repeated on four mice for each genotype: (left) PCR bands for the indicated alleles; (right) western blots for GAPDH (loading control) and ARID1A.
c, YAP IHC staining in control and Nf2 mutant livers. Scale bars, 40 μM. Shown are representative images independently replicated on three mice for each genotype with similar results.
d, Compendium of Fig. 2e. Representative Cytokeratin (CK; top) and Ki67 (bottom) stainings in sections of livers of the indicated genotypes (same as in Fig. 1d-e, and Extended data Figure 5a). Note intrahepatic cholangiocarcinomas (iCCA; CK-positive, Ki67-positive) and hepatocellular carcinomas (HCC; Ki67-positive, but CK-negative) only in livers from Nf2/Arid1a LKO. Scale bars, 100 μm. Shown are representative images independently replicated for all the mice of each genotype, with similar results.
e, Quantitative real-time PCR analysis of selected genes from liver of mice with the indicated genotypes. All animals were included. Data (mean + s.d. of n mice per genotype, as in Extended data Figure 5a above) are normalized to Nf2/Arid1a LKO mice.
f, Compendium of Fig. 2f. Control, Arid1a LKO, Arid1a/Yap/Taz LKO mice were treated with tamoxifen and then were fed DDC-containing diet for 6 weeks. Panels are CK (top; scale bars, 40 μM) and Ki67 (bottom; scale bars, 20 μM) stainings of liver sections from the indicated mice. Note the presence of early cholangiocarcinoma lesions (CK-positive, Ki67-positive) in the Arid1a LKO mice and their absence upon concomitant YAP/TAZ loss (i.e., in the Arid1a/Yap/Taz LKO mice). Asterisks indicate porfirin deposits, typically present in liver of animals treated with DDC. Shown are representative images, independently replicated for all the mice of each genotype (n as in Fig. 2f), with similar results.
g, Representative qRT-PCR analysis for Afp expression (mean + s.d. of n mice) in the livers from control (n=4), Arid1a LKO (n=5), Arid1a/Yap/Taz LKO (n=5) mice treated with tamoxifen and then DDC. Data are normalized to livers of mice not treated with DDC (n=4). This experiment was independently repeated three times with similar results, analyzing, in total, at least 10 mice for each genotype.
h, Representative E-cadherin staining (scale bars, 30 μm) showing that CCA lesions retain epithelial morphology in sections of livers of the indicated mice. Experiments were independently repeated on three mice, with similar results.
P values were determined by one-way ANOVA with Dunnett’s multiple comparisons test in a or with Tukey’s multiple comparisons test in e and g.

