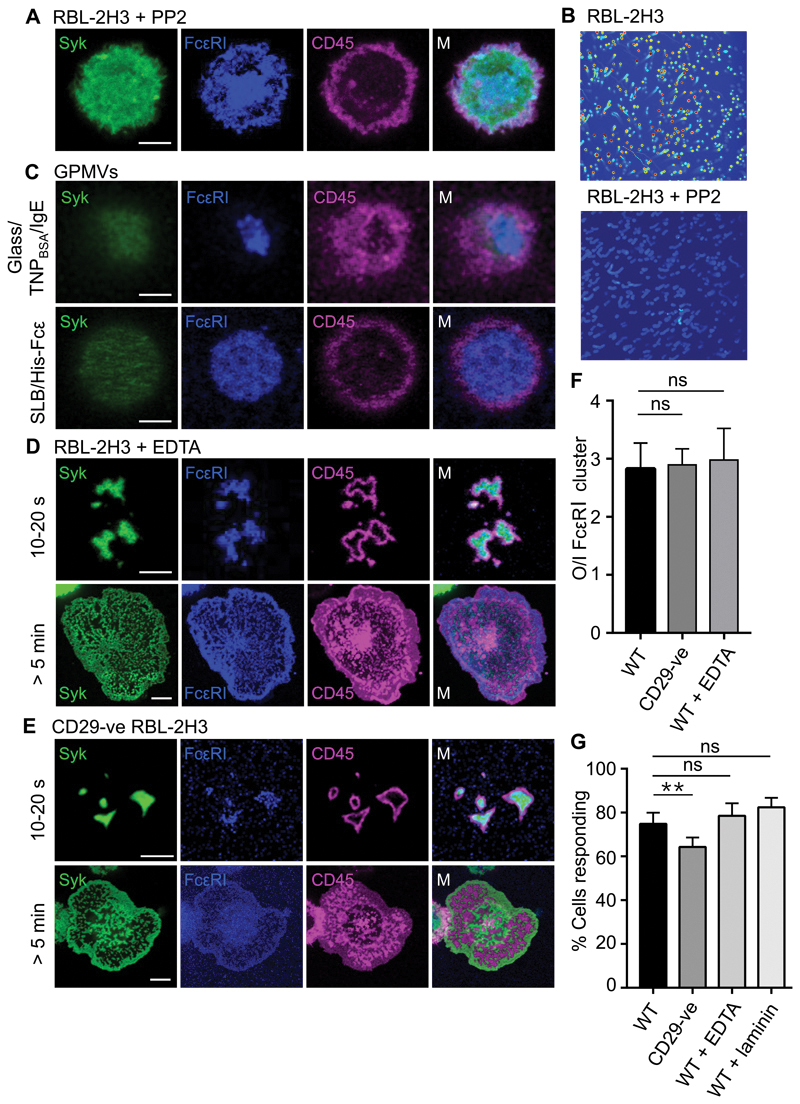
Fig. 4. CD45 exclusion is passive and independent of integrin activity.
(A) Confocal fluorescence images of Syk, FcεRI, and CD45 at the basal surface of an RBL-2H3 cells treated with PP2 after making contact with TNPBSA-IgE-coated glass (a line profile is shown in fig. S5). (B) Effect of PP2, as used in (A), on FcεRI triggering as measured by Ca2+ flux intensity. Images are 10-min maximum intensity projections for Ca2+ intensity scaled as a heat map; blue, low intensity; red, high intensity. (C) Confocal fluorescence images of Syk, FcεRI, and CD45 at the basal surface of RBL-2H3–derived GPMVs after making contact with TNPBSA-IgE-coated glass (upper) or a His-Fcε–functionalized SLB (lower). (D) Confocal fluorescence images of Syk, FcεRI, and CD45 at the basal surface of RBL-2H3 cells after making contact for the indicated times with TNPBSA-IgE-coated glass in the presence of EDTA to chelate divalent cations. (E) Confocal fluorescence images of Syk, FcεRI, and CD45 at the basal surface of CD29-ve RBL-2H3 cells after making contact for the indicated times with TNPBSA-IgE-coated glass. (F) Ratio of CD45 fluorescence intensity outside (O) versus inside (I) areas of enriched FcεRI intensity, for WT, CD29-ve, and EDTA-treated RBL-2H3 cells. Data are means ± SD of three independent experiments, with > 5 cells assessed per experiment. (G) Percentages of WT, CD29-ve, and EDTA-treated RBL-2H3 cells that produced Ca2+ flux responses within 10 min of making contact with glass coated with TNPBSA-IgE or TNPBSA-IgE and rat laminin peptide. Data are means ± SD of four independent experiments. Images are representative of observations made in at least three independent experiments. Scale bars, 5 µm. **P < 0.01; ns, not significant.

