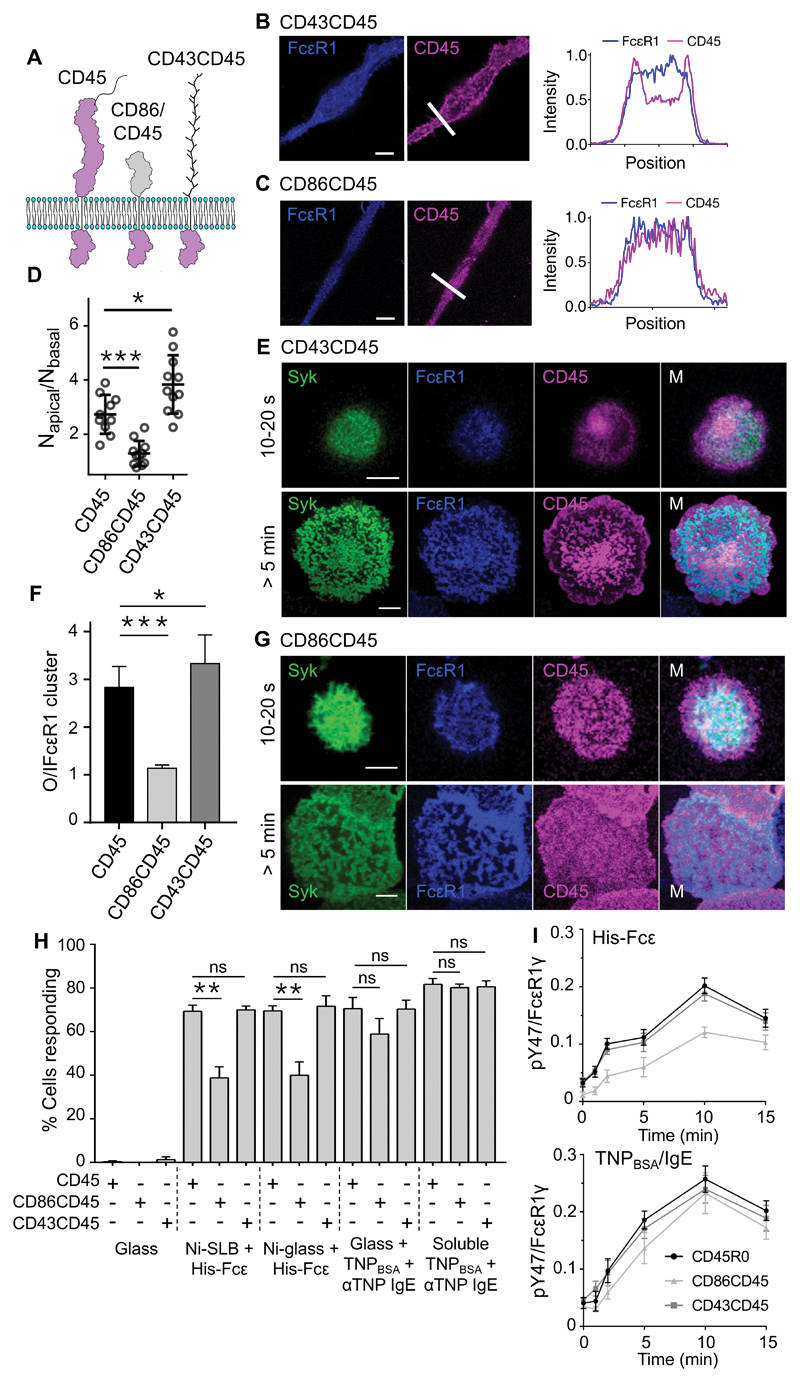
Fig. 6. FcεRI triggering relies on the large extracellular domain of CD45.
(A) Schematic of WT and chimeric CD45 constructs, which are colored purple to reflect their color in the fluorescence images. (B and C) Left: FcεRI and CD43CD45 (B) or CD86CD45 (C) fluorescence at the basal surface of RBL-2H3 cells cultured for 24 hours on glass. Right: Line profiles of fluorescence intensity corresponding to the arrows in the images. (D) Local concentration, that is, the average number of molecules in the observation volume (measured by fluorescence correlation spectroscopy), for CD45 and CD43CD45 at the basal versus apical surfaces of RBL-2H3 cells compared to those for CD86CD45. Data are means ± SD of three independent experiments, with >3 cells analyzed per experiment. (E) Confocal fluorescence images of Syk, FcεRI, and CD43CD45 at the basal surface of an RBL-2H3 cell after making contact for the indicated times with TNPBSA-IgE-coated glass. (F) Fluorescence intensity for CD45, CD86CD45, and CD43CD45 outside (O) versus inside (I) areas of enriched FcεRI intensity. Data are means ± SD of three independent experiments, with >5 cells assessed per experiment. (G) Confocal fluorescence images of Syk, FcεRI, and CD86CD45 at the basal surface of an RBL-2H3 cell after making contact for the indicated times with TNPBSA-IgE-coated glass. (H) Percentages of RBL-2H3 cells expressing CD45, CD86CD45, or CD43CD45, that produced Ca2+ fluxes within 10 min of making contact with an SLB or Ni-coated glass functionalized with His-Fcε, TNPBSA-IgE-coated glass, or after being incubated with soluble anti-TNP and TNPBSA. Data are means ± SD of four independent experiments. (I) Normalized anti-pY47 FcεRIγ signals relative to anti-FcεRIγ signals for whole-cell lysates prepared from RBL-2H3 cells expressing CD45, CD86CD45, and CD43CD45 after making contact for the indicated times with Ni-coated glass functionalized with His-Fcε (top) or with TNPBSA-IgE-coated glass (bottom). Data are means ± SD of three independent experiments. All images are representative of observations made in at least three independent experiments. Scale bars, 5 µm. *P < 0.05, **P < 0.01, ***P < 0.001; ns, not significant.

