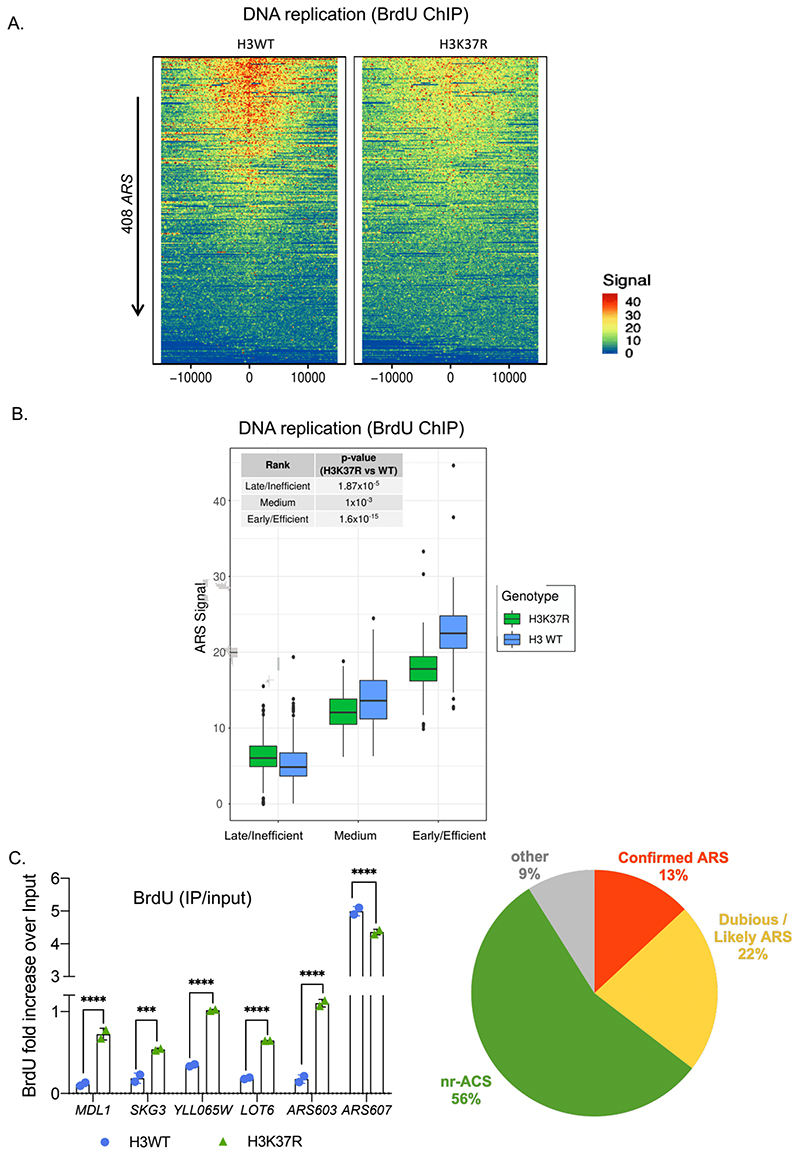
Figure 4. H3K37me1 regulates DNA replication.
(A) Heatmap showing the distribution of BrdU incorporation at replication origins in wild-type H3 and H3K37R mutant cells. Origins were aligned from highest to lowest BrdU signal in the wild-type strain and centred at ARS ACS (Ars Consensus Sequence). For visualisation purposes the heatmaps’ colour scale was saturated at the 99th percentile of the distribution of signal intensities. The plot represents the average of 4 independent experiments. (B) Box-plot showing the distribution of mean BrdU signal incorporated at the replication origins (ARS +/- 1kb) shown in (A). The p-values were calculated with the Mann-Whitney-Wilcoxon test. ARSs were classified into early/efficient, medium and late/inefficient following the BrdU distribution shown in Figure S5C. (C) ChIP qPCR experiments showing incorporation of BrdU in H3WT and H3K37R mutant cells. IPs were analysed by qPCRs at the early/efficient ARS607, late/inefficient ARS603 and “H3K37R-unique” firing locations, using specific primers. Statistical analysis was performed using Two-way ANOVA corrected for the comparisons using the Holm-Sidak method (Alpha: 0.05); * - P ≤ 0.05, ** - P ≤ 0.01, *** - P ≤ 0.001, **** - P ≤ 0.0001. Error bars represent the mean ± SD of 2 independent experiments. (D) Piechart showing proportion of H3K37R unique replication events occurring at different genomic locations.

