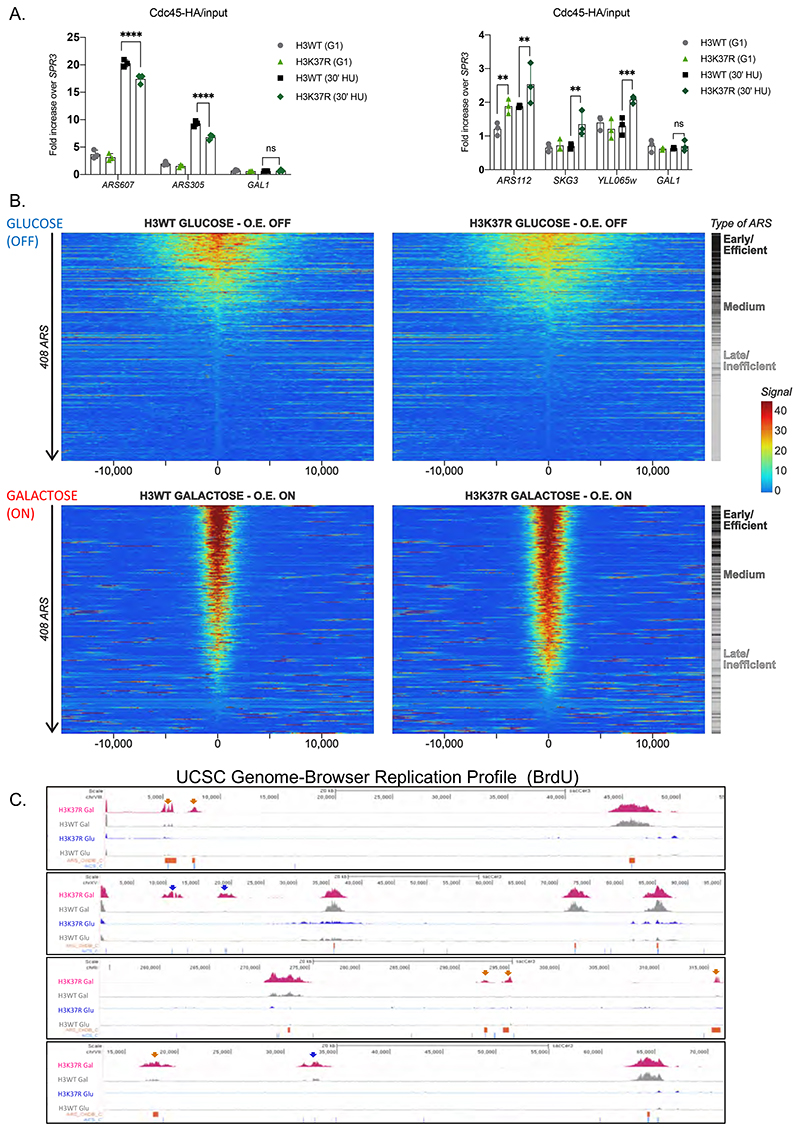
Figure 6. Over-expression of MCM activators suppresses H3K37R replication defects.
(A) ChIP qPCR experiments showing Cdc45-HA levels at efficient ARS (left panel) and “H3K37R unique” replication sites (right panel). H3WT and H3K37R yeast cells expressing Cdc45-HA were arrested in G1 and released into HU containing medium for 30’. Samples were crosslinked and chromatin was immunoprecipitated (IP) with anti-HA antibody. The IP material was analyzed by qPCR with primers specific for each location. Data were normalized to a non-ARS region (SPR3). Statistical analysis was performed using Two-way ANOVA corrected for the comparisons using the Holm-Sidak method (Alpha: 0.05); * - P ≤ 0.05, ** - P ≤ 0.01, *** - P ≤ 0.001, **** - P ≤ 0.0001. Error bars represent the mean ± SD of 2 independent experiments. Note the difference in the scale between left and right panels. (B) Heatmap showing the distribution of BrdU incorporation in wild-type H3 and H3K37R mutant cells under non-overexpression (GLUCOSE, OFF) and over-expression (GALACTOSE, ON) of MCM activators. Replication origins were aligned from highest to lowest BrdU signal in the wild-type strain and centred at ACS. ARSs were classified into early/efficient, medium and late/inefficient following the BrdU distribution shown in Figure S5C. For visualisation purposes the heatmaps’ colour scale was saturated at the 99th percentile of the distribution of signal intensities. The plot represents the average of 3 independent experiments. (C) Representative genome browser snapshots of BrdU incorporation in H3WT and isogenic H3K37R mutant cells at different genomic locations. ARS (OriDB) are represented as orange boxes; non-replicative ACS matches are represented as blue lines. H3K37R exclusive firing event are indicated by the corresponding color-coded arrows. The plots represent the average of 3 independent cultures per strain and condition.

