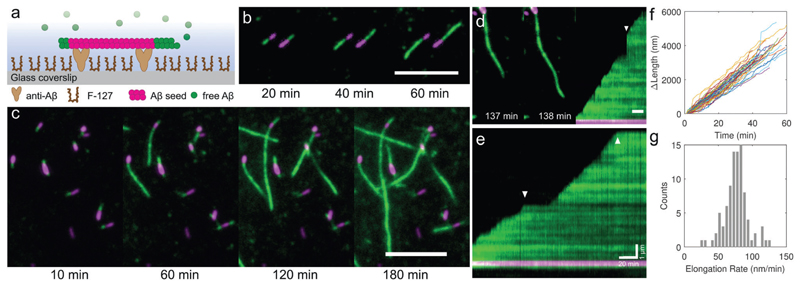
Fig. 1. A two colour TIRF elongation assay enables in situ imaging of the dynamics ofAβ42 fibril elongation from preformed seeds.
(a) Schematic of the TIRF imaging assay. Labelled seed fibrils (magenta, 5% HiLyte Fluor 647) were tethered to a coverslip via N-terminal specific anti-Aβ and the glass was passivated with Pluronic F-127 to reduce monomer adsorption and primary nucleation. Monomeric Aβ42 (green, 5% HiLyte Fluor 488, 10 μM total concentration) was added and the surface imaged over time at 37 °C using TIRF microscopy. (b and c) In situ observation of amyloid elongation dynamics from seeds. TIRF images show that the growth rates are different for each fibril end. Scale bars 5 μm. (d) Some fibrils became detached from the surface but continued to elongate, followed by their reattachment to the surface (arrow in right hand kymograph). (e) Kymographs show that growth from the fast end of the fibril is continuous and interrupted by pauses (arrows). (f) Change in length of an ensemble of fibrils over time, with paused sections removed (N = 59 fibril traces). (g) Histogram of the pause-free fast end elongation rates, 76.2 ± 17.9 nm min−1 (mean ± S.D.), for 10 μM monomeric Aβ42 at 37 °C.

