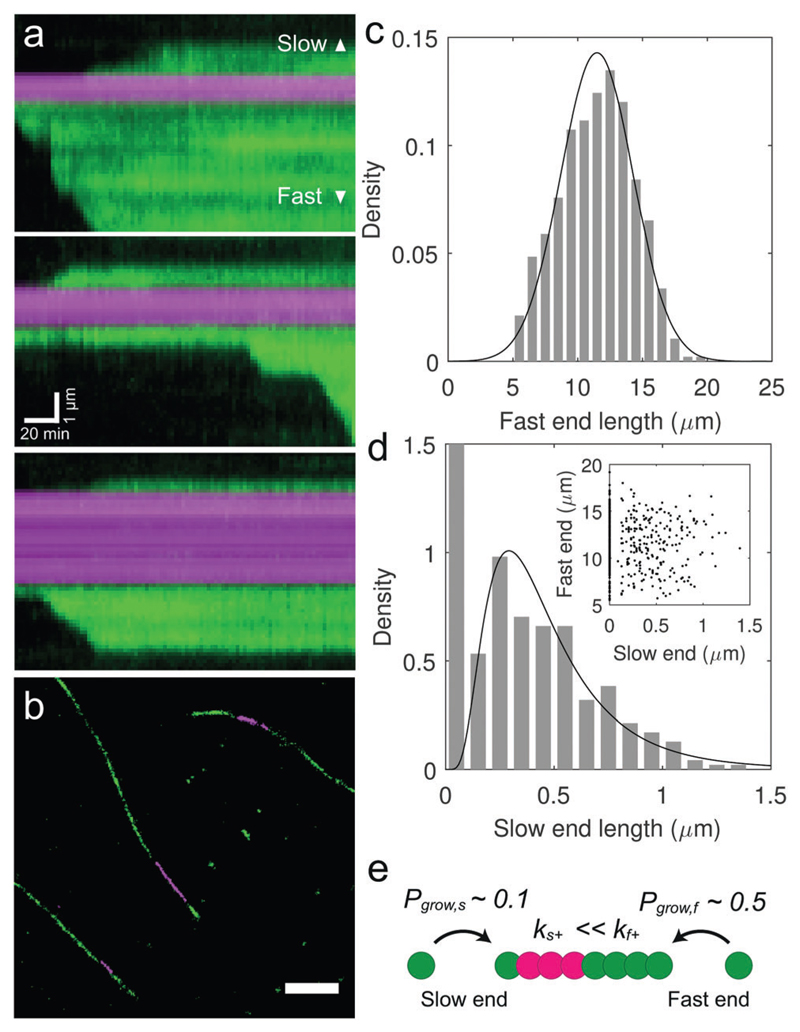
Fig. 4. Aβ42 fibrils exhibit a fast and a slow growing end.
(a) Kymographs show that slow ends elongate at a reduced rate (10–20 nm min−1) compared to the fast end (50–100 nm min−1), and grow only sporadically. (b) Ex situ imaging of Aβ42 fibrils by two colour super-resolution fluorescence microscopy permits a precise measurement of the slow end length. The panel represents a selected region from a larger field of view obtained by dSTORM imaging, as shown in Fig. S5, panel a (ESI†). Scale bar: 1 μm. (c and d) Histograms of the fast and slow end lengths after 5 h incubation of seed fibrils with 10 μM monomer. Data fits correspond to normal and log-normal distributions with mean lengths of 11.5 and 0.47 μm respectively. 51% of seeds showed no observable growth at their slow end after 5 h. Note that the y-axis was rescaled to emphasize the distribution of slow end lengths greater than zero. N = 475. (d, inset) A scatter plot of slow versus fast end length for each fibril revealed no correlation between the elongation rates at opposing ends. (e) Aβ42 fibril polarity results from different elongation rate constants, k+, and growth probabilities, Pgrow, at the fast and slow growing fibril ends.

