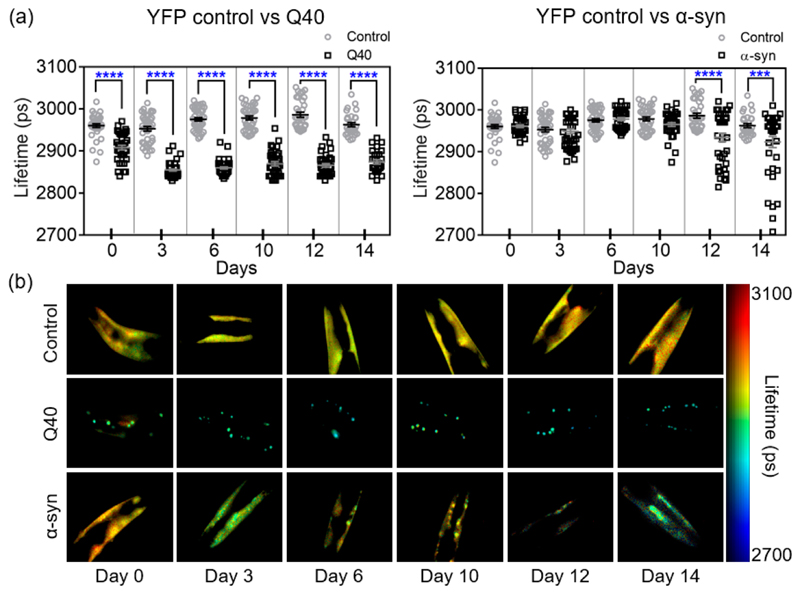
Figure 2. TG-FLIM imaging of protein aggregation in Q40 and α-syn strains across the lifespan of the animals.
(a) Fluorescence lifetimes at days 0, 3, 6, 10, 12, and 14 of adulthood for Q40 and α-syn compared to YFP controls. Squares and circles represent the average lifetime of the fluorescence from the head region of each imaged worm. Statistical analysis was performed using a one-way ANOVA, ***p < 0.005, ****p < 0.0001. The data shown are pooled from two biological replicates totalling ca. 40 worms per strain and time point. An F-test of YFP control lifetimes comparing data over the 15 days showed no significant deviation from a zero-slope, indicating that our data are compatible with a constant lifetime for the YFP control over the lifespan of the animal (p = 0.90). (b) Representative worm FLIM images for each day and each strain.

