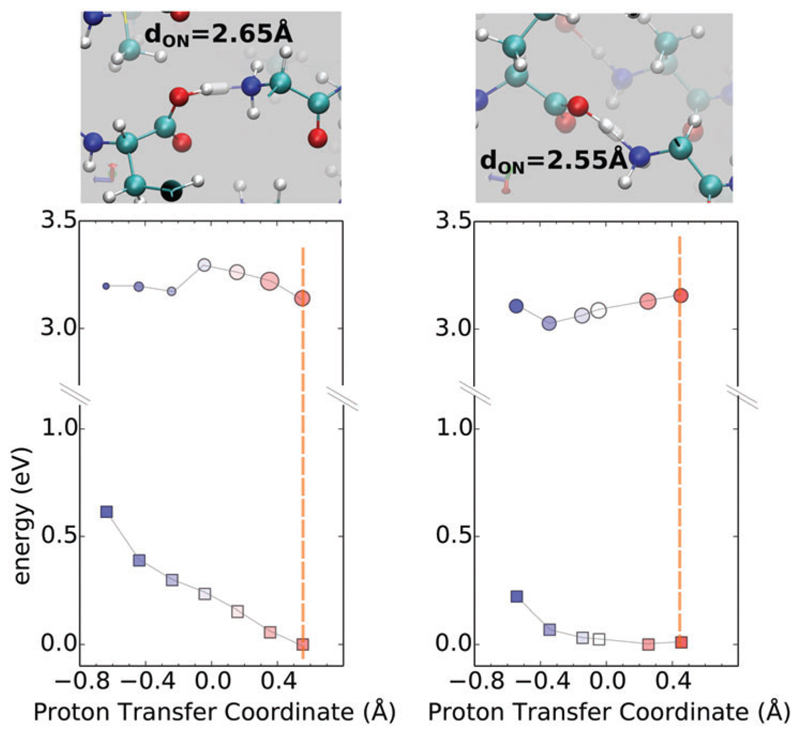
Fig. 5.
Ground and first excited-state PES is shown in squares and circles respectively using the zero-K equilibrium structure along the PTC at the N–C termini. In both these situations, the proton is stabilized on the C terminus. The size of circles is proportional to the oscillator strength of the transition. Colors from red to blue qualitatively match the displacement from oxygen to nitrogen. The vertical dashed bar serves as a guide for the equilibrium position. Figures on the top of each graph show the relevant steps along the PT coordinate.

