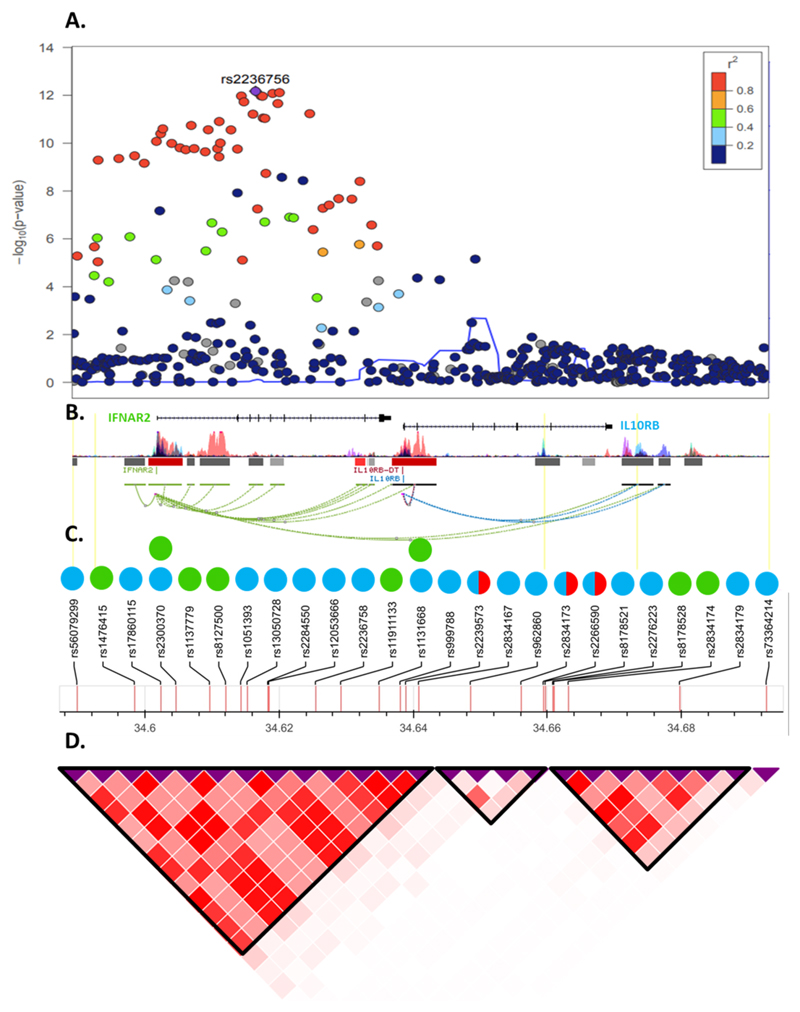
Figure 3. Genomic context, local association plot and LD structure of the IFNAR2/IL10RB region.
a, Local association plot (N=1,377,758) of the interval defined by all unique eQTLs for IL10RB or IFNAR2. Color code represents the degree of linkage disequilibrium with the most associated marker in 1000G Europeans. b, Genomic context of the region. Coding genes are represented by the refseq transcript. Bars represent epigenome Roadmap layered H3K27 acetylation markers. Connecting lines represent significant Hi-C interactions. c, Set of rsIDs used as proposed instruments for Mendelian Randomization analysis. Color code represents instruments for IL10RB (blue circles), IFNAR2 (green circles). Orange half-circles represent pQTLs for IL-10RB. d, Linkage disequilibrium structure and blocks defined using European populations from 1000G project.

