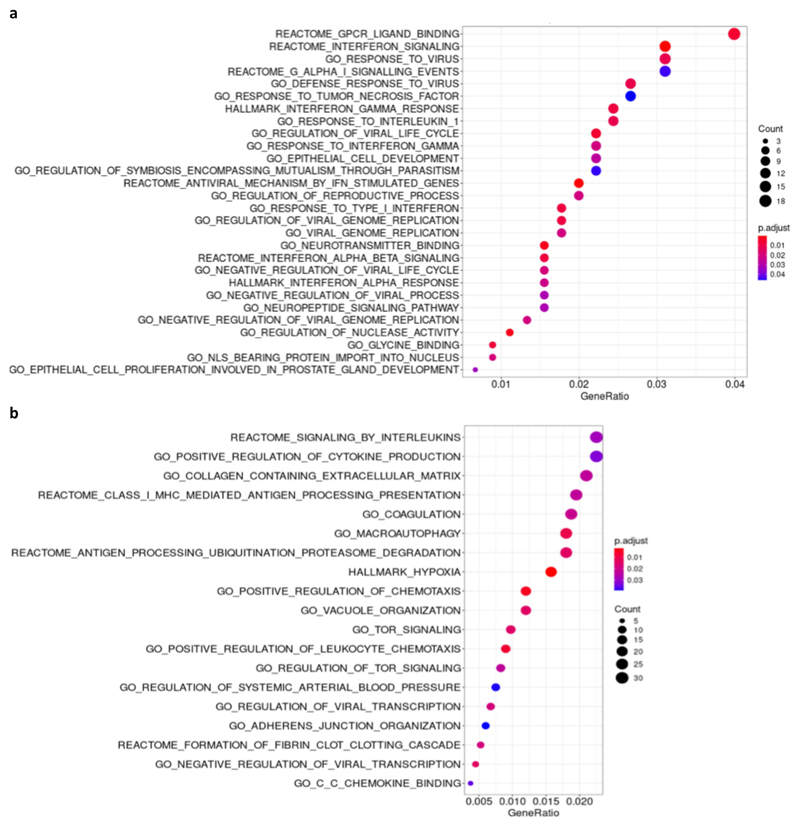
Extended Data Fig. 2. Enrichment analysis of peak eQTLs for IFNAR2-IL10RB and ACE2 regions.
Results obtained from association analysis using all 49 tissues from GTEx V8 contrasted against variant genotypes in an additive model. Dotplot of over-representation analysis using all significant (p<0.05) differentially expressed (DE) genes (476 for rs13050728; 1,397 for rs4830976) for a, rs13050728, peak eQTL in the IFNAR2-IL10RB region and b, rs4830976, peak eQTL in the ACE2 region. Count = number of DE genes part of the enriched pathway. Gene ratio is the rate of DE genes represented in each pathway.

