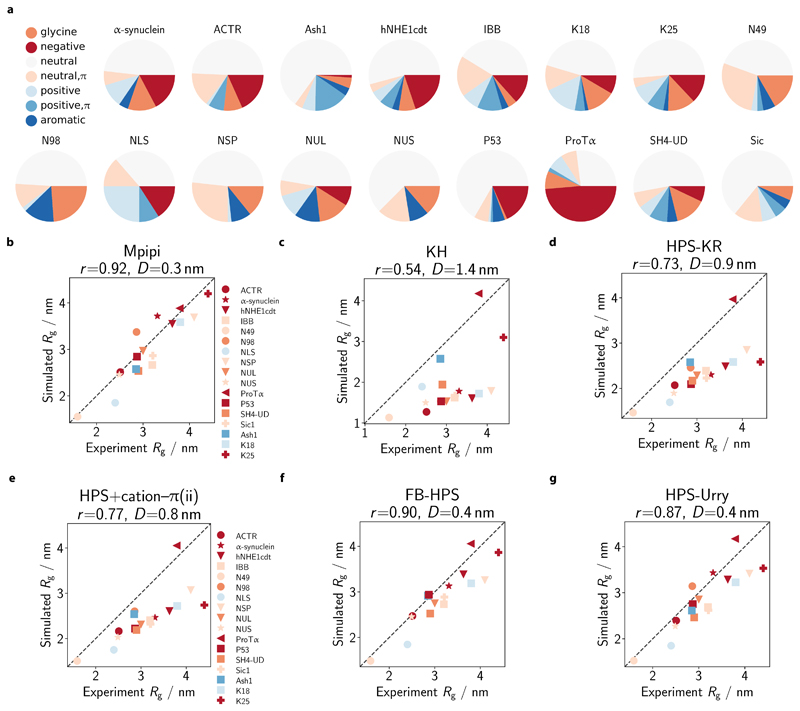
Figure 4. Comparison of single-molecule radii of gyration with experiment.
a Composition of simulated IDPs. We select 17 IDPs for which experimental radii of gyration (Rg) are available (see SI Sec. S2.1 and SI Table III) and assess the composition of the IDPs in terms of the proportion of glycine (orange), neutral (dark yellow; no net charge at pH 7 and no π electrons in side-chain: A, C, I, L, M, P, S, T, V), neutral with π (green; no net charge at pH 7 with π electrons in side chain: N, Q), positive (cyan; without π electrons in side-chain: K), positive with π (blue; with π electrons in side-chain: H, R), negative (red: D, E) and aromatic (magenta: F, W, Y) residues. b–g Comparison of simulated and experiment Rg. Rg values are computed at 300 K in each model. Each protein is coloured based on its dominant residue class (as categorised in a and excluding the ‘neutral’ class). The broken line represents the ‘perfect fit’ line. For each model, the Pearson correlation coefficient r and the root mean squared deviation D are reported in the respective figure title.

